Pharmakeyboard_arrow_rightAnalytical comparison between batch and CDC processes for pharmaceutical manufacturing using an innovative UV-Vis reflectance method and chemometrics.
menu

The present study aims to compare a traditional batch manufacturing process with an alternative continuous one. To this end, a real pharmaceutical formulation was used, substituting the active pharmaceutical ingredient (API) with riboflavin, at the concentration of 2 %(ω/ω).
Advancements in industrial technologies and the application of quality by design (QbD) guidelines are shifting the attention of manufacturers towards innovative production techniques. In the pharmaceutical field, there is a significant focus on the implementation of continuous processes, in which the production stages are carried out continuously, without the need to interrupt the process and store the production intermediates, as in traditional batch production. Such innovative production techniques also require the development of proper analytical methods able to analyze the products in-line, while still being processed.
The present study aims to compare a traditional batch manufacturing process with an alternative continuous one. To this end, a real pharmaceutical formulation was used, substituting the active pharmaceutical ingredient (API) with riboflavin, at the concentration of 2 %(ω/ω). Moreover, a direct and non-destructive analytical method based on UV–Vis reflectance spectroscopy was applied for the quantification of riboflavin in the final tablets, and compared with a traditional absorbance analysis. Good results were obtained in the comparison of both the two manufacturing processes and the two analytical methods, with R2 higher than 0.9 for all the calculated calibration models and predicted riboflavin concentrations that never significantly overcame the 15 % limits recommended by the pharmacopeia.
The continuous production method demonstrated to be as reliable as the batch one, allowing to save time and money in the production step. Moreover, UV–Vis reflectance was proved to be an interesting alternative to absorption spectroscopy, which, with the proper technology, could be implemented for in-line process control.
In industrial processes, the Continuous Manufacturing process consists of a single line of different unit perations where the process is carried out without stopping the material flow (Lee, 2015). Therefore, raw materials are constantly inserted into the process line and, simultaneously, the products are removed. This approach differs from the traditional “batch” system, where every operation is executed separately (Lee, 2015). In this case, each operation is carried out for a defined quantity of materials each time, and it is possible to collect and check the intermediates before starting the next phase. The batch system has been the standard method of production for the pharmaceutical industry since its foundation, and this production field, as opposed to other consumer products, has been rather conservative towards conversion to the continuous process (Engisch and Muzzio, 2016). The reasons for such opposition can be found in a number of advantages provided by the batch method, such as the flexibility of the unit operations (that can be easily reorganized for a different production line), simple optimization, and easy traceability, fundamental in the case of product recall (Ierapetritou et al., 2016). However, this approach also presents some downsides, starting from the major number of operations required for handling, storing, and checking the intermediates between each phase, which translates into longer production times and increased costs, or greater variability due to a high proportion of manual procedures, and the need for scale-up (Ierapetritou et al., 2016). Continuous Manufacturing has its strengths in terms of production time and cost optimization, offering a faster response to market demands, a reduced environmental impact, and the potential to improve the quality of the products, due to the high degree of monitoring and automatization. All these features are in line with the principles of Quality by Design (QbD) guidelines (Wahlich, 2021). The perspective of improved process control through the application of process analytical technology (PAT) and the increased product quality has also attracted the interest of the major regulatory agencies, that have supported the introduction of these new technologies for years (Wahlich, 2021). However, although Continuous Manufacturing has been considered adaptable to the existing legislation, the lack of experience and the absence of internationally recognized regulations has been a critical factor, delaying the implementation of this production method for many years (Vanhoorne and Vervaet, 2020). From 2015 to 2022, only seven continuously produced drugs were approved by the major governmental drug security agencies (FDA, EMA, and PDMA) (Wahlich, 2021). At present, the increasing number of publications on PAT technology and monitoring for continuous systems (Fonteyne, 2015; Roggo, 2020; Gouveia, 2017; Vargas, 2018) and recent developments in the regulatory framework could promote a larger adoption of Continuous Manufacturing in the pharmaceutical industry. Examples of improvement in regulatory issues are the release of global guidelines, specific to Continuous Manufacturing, from the International Conference on Harmonization (ICH – Q13) with the final document published in November 2022 (ICH Guideline, 2023), now beginning to be adopted by the main national regulatory agencies, as reported on the official site (ICH), or the graduation of Continuous Direct Compression (CDC), from the Emerging Technology Program of the FDA on October 2021 (FDA, 2023). The aim of the present study is to compare a traditional batch system with the corresponding continuous manufacturing process for tablet production. The comparison has been carried out based on the final tablet quality. Direct compression is the simplest process for tablet production (Suzuki, 2021), which consists of three-unit operations: i) dosing the correct concentration of ingredients in powder form, ii) mixing the components to obtain a homogeneous blend, and iii) compressing single doses of the mixture into final tablets. The continuous line combines these operations, so that, through loss-in-weight feeders, single ingredients are automatically dosed in the mixer. Here the components are blended while being transported towards the tablet press, to which the mixer is connected. Therefore, the entire compression process is executed along a single line where no intermediate operation is needed. Tablet quality was assessed through the evaluation of tablet weight and active pharmaceutical ingredient (API) concentration, measured with a UV–Vis spectrophotometric method in transmission. Moreover, tablets were also analyzed by an innovative quantitative method using UV–Vis diffuse reflectance spectroscopy (DRS). This technique allows the direct analysis of solid tablets, with the advantage of a non-destructive and very rapid analysis. Applications of reflectance spectroscopy in the UV–Vis range for the determination of pharmaceuticals are not common. M´esz´aros et al. (M´esz´aros, 2020) applied multivariate analysis techniques to UV–VIS imaging for tablet quantification, but to the authors’ knowledge, the only example of an application of DRS for solid tablet analysis is reported in the work of Kessler et al. (Kessler et al., 2009) where multivariate curve resolution (MCR) was used for the quantification of tablet components. Most of the applications of DRS are reported for the analysis of ointments or solutions deposited on solid supports (Gotardo et al., 2008; Tubino and de Souza, 2006; Tubino et al., 2009). Another common application of DRS in the UV–Vis range is in environmental fields, for example in the analysis of metal oxide in soil samples (Islam et al., 2003; Torrent and Barr´on, 2008; Szalai et al., 2013; Chauhan et al., 2021), and the identification of Saharan dust events in particulate matter filters (Morozzi, 2021). Direct quantification on tablets in reflectance is more frequent on the NIR range as an application of PAT, some recent publications serve as an example (Dalvi, 2019; Chong et al., 2017; Guio et al., 2021; Murayama et al., 2018). In the present work, we tested the application of UV–Vis DRS as a rapid method for the quantification of riboflavin in tablets, with the aim of proposing it as a valid alternative for quality control. This was carried out by comparing the DRS results with those obtained using the transmission method.
The formulation used for this study was based on a real commercial product composed of six ingredients: three diluents, a disintegrant, the API, and the lubricant, indispensable for compression operation. The complex formulation allowed the process to be tested in conditions as close as possible to real production.
The complete formulation cannot be disclosed and remains an industrial secret. Riboflavin was chosen as a proxy of the API, mainly due to its color (yellow) which makes it clearly visible in the tablets even by the naked eye (other ingredients were white), and due to its characteristic UV–Vis spectrum that simplifies the chemical analyses. Moreover, the vitamin B2 (riboflavin) High Flow 100 formulation (BASF), optimized for direct compression, was selected to facilitate the feeding operation of the ingredient during the continuous process. Microcrystalline cellulose (Microcel® PH102) was used as the main diluent of the formulation, and magnesium stearate (FACI Group S.p.A., Italy) was used as the lubricant.
Continuous and batch technologies are both composed of feeding/dispensing, blending, and compression stages. For the continuous mode, feeding and blending steps were carried out by the Gericke Formulation Skid (Gericke, Regensdorf, Switzerland) which is made up of 3 different loss-in-weight feeders (LIW): a Feedos (LIW1), a GZD 200.12 (LIW2) and a GZD 100.12 (LIW3), and a GCM 450 blender. For the batch technology, due to geometric dilution the blending step was performed using both the Cyclops Lab and the Cyclops Mini (IMA S.p.A. Active, Ozzano dell’Emilia, Italy) equipped with 15 L and 100 L Bin (IMA S.p.A. Active, Ozzano dell’Emilia, Italy) respectively. Prexima 300 (IMA S.p.A. Active, Ozzano dell’Emilia, Italy) was used for the compression stage of both technologies.
A batch trial (called B1) was run at the target riboflavin concentration of 2 %(ω/ω) for comparison with the continuous process and model validation. For this trial, 30 kg of blend material were prepared by manually weighing the ingredients at the desired proportions and then mixed by performing the following procedure. Following the principle of the geometric diluition, the dosed API was manually mixed with 0.4 kg of diluent for three minutes. Such blend was loaded inside a 15-L bin, adding 3 kg of diluent, and mixed at 14 rpm for 15 minutes with the Cyclops Lab. The total quantity of material corresponded to a filling level of the bin of about 55%. The blend was then mixed with the remaining excipients, excluding the lubricant, inside a 100-L bin with Cyclops Mini for 15 minutes at 14 rpm. Finally, the lubricant, magnesium stearate, was added to the bin, for a final filling level of 60%, and mixed for 3 minutes at 14 rpm, to avoid over-lubrication. To control the blending homogeneity, the two final steps, carried out in the 100-L bin, were monitored with an in-line NIR probe (VIAVI Solution Inc., Chandler, USA; MicroNIRTM PAT-W, spectral range 10,526 – 6060 cm-1). NIR spectra were elaborated by moving-block analysis (results not shown) (Rosas et al., 2013) that guaranteed homogeneity of the blend starting from 5 minutes of mixing until the end of the process, as expected from a well established process. The blend was then loaded onto a Prexima 300 rotatory press, mounting 41 Eu-BB stations turret with 9-mm round concave punches. The speed of the press was maintained on average at 50 rpm to reach a one-hour long production run, corresponding to 30 kg h-1 throughput, analogous to the setting of the continuous process. During the run, 100 tablets were sampled both at the beginning of production and every 10 minutes for one hour.
Continuous production was tested on a CDC line composed of a Gericke Feeding Blending Unit, for the dosing and mixing operations, and the Prexima 300 as the rotatory press. The press and relative setting were the same used during the batch trials. In this setup, a chute is connected to the blender exit, positioned above the press, directly to the feed frame of the tablet press, creating a single line of production. The feed frame was equipped with a level sensor that adjusted the speed of the tablet press to the filling level of the feed frame.
The dosing station included three loss-in-weight feeders. Since the formulation contained six components, a pre-blend of three excipients (diluents and disintegrants) was prepared with the Cyclops Mini batch mixer and introduced into the first feeder (LIW1) mounting a 15-L hopper, leaving the two remaining LIW2 (8 L) and LIW3 (1 L) available for the API and the lubricant respectively. Feeder LIW1 was equipped with an automatic system for the refill operation, consisting of a 10-L hopper and a vacuum conveyor. The pneumatic aspiration system loads the pre-blend onto the hopper positioned above the feeder, the powder flow is then controlled through a valve that opens when the refill level of the feeder is reached. The refill operations for LIW2 and LIW3 were carried out manually. A volumetric control was active during the refill operation instead of the standard gravimetric control, for all the feeders.
The mechanical setup was a 30-mm single screw for the LIW1, while LIW2 and LIW3
were equipped with 12-mm diameter twin screws with a 6- and 7-mm pitch respectively. Preliminary optimization tests were conducted to verify the stability of the target feeding throughput in the selected conditions, evaluating the standard deviation in percentage (%RSD) of the feeding rate recorded by the control system. Continuous blending was carried out with the tubular continuous mixer GCM 450 mounting a diagonal weir at the outlet to help modulate the mean residence time (τ) of the blend inside the mixer. Through preliminary tests, it was verified that with this mechanical configuration, the impeller speed of 160 rpm was able to maintain τ at 40 s, reported as an optimal value for homogeneous blending (Oka and Kleinebudde, 2017). LIW1 and LIW2 were connected to the blender at the first inlet of the three available, farther from the exit, while magnesium stearate in LIW3 was introduced through the second inlet. Lubricants were added last to avoid over-lubrication of the blend. In this case, the middle inlet was chosen for the lubricant since the short residence time already prevented an excessive mixing of the ingredients. The final flow rate of the blend was set to 30 kg hτ 1. Before starting production, the continuous apparatus was used to produce blank tablets containing only the pre-blend and the lubricant, while the API line was completely cleaned. The continuous setup was used to prepare calibration tablets at three different concentrations of riboflavin (1%, 2%, 3% (ω/ω)), in this case adjusting consequently the pre-blend proportion of the mixture. The calibration run lasted around 15 minutes and the press and blender were completely emptied before starting with further production. For the comparison with the traditional method, three test runs at the target concentration of 2% (ω/ω) of riboflavin were conducted: a short, 30-min run (C1) and two longer runs of 2 h (C2, C3). Sampling consisted of 100 tablets from the start of the stationary state and every 10 minutes of production.
The physical properties of tablets were assessed by measuring the weight, hardness, thickness, and diameter of 20 tablets for every sampling, through an automatic analyzer Kraemer UTS4.1 (Ischi Kraemer Elektronik GmbH).
The reference method used for the determination of riboflavin in tablets was a transmission method in solution, using a Shimadzu UV- 2600i spectrometer (Shimadzu, Kyoto, Japan). Four standard solutions of riboflavin were prepared to create a calibration curve. Dilutions at concentrations of 1, 3, 6, and 10 ppm were prepared from a 30-ppm standard solution obtained by dissolving pure riboflavin powder (High Flow 100 – BASF, Ludwigshafen, Germany) in ultrapure water, then sonicated for 2 minutes. Riboflavin presents four characteristic absorbance bands in the UV–Vis region. In the present study, the area of the band with the maximum at 265 nm was selected as the curve response. For sample preparation, a tablet was weighed, then dissolved in 100 mL of distilled water and sonicated for 2 minutes. An aliquot was then centrifuged, to remove the insoluble excipients, for 90 s at 13.2 rpm and the supernatant was diluted 1:10 in distilled water. Three replicates (different dilutions of the supernatant) were analyzed for each sample. The weight (mg) of riboflavin obtained from the interpolation on the calibration curve was then divided by the weight of the tablet to determine the percent dosage. With this method, 3 tablets of each test run were analyzed, randomly chosen, from 20-min samplings.
The reflectance method allowed the solid tablets to be analyzed directly and did not require any sample preparation. The signal was registered using the integrating-sphere tool of the Shimadzu UV-2600i spectrometer. The zero-degree configuration was used (Morozzi, 2021), in which the beam hits the sample with a 0° angle, so the specular reflection component follows the direction of the incident light and is excluded from the analysis, while the diffuse reflection component is amplified inside the sphere and recorded by the detector. Since no reference method was available for this type of application, a preliminary study was carried out to identify the characteristic riboflavin signal and define the analysis conditions. The mixture and the single components were analyzed in powder form, filling a quartz cell with the ingredient, and positioning them in the sample holder. Tablets, instead, were placed inside a 9-mm opening created on a thin steel disk, and then inserted into the film holder provided with the instrument. With this configuration, tablets were always positioned at the same height, and it was verified that the beam hit the center of the sample. For this study, the baseline correction was initially obtained with the BaSO4 plates available with the instrument, then the correction with blank tablets (prepared without riboflavin) was tested. The signal was initially acquired on the full spectrophotometric range, between 200 and 900 nm with a step of 0.5 nm. After the preliminary study, all tablet samples, both for calibration and for validation of the model, were analyzed with the following setup:
For the creation of the calibration curve, spectra from 15 tablets were acquired, five for each available concentration (1 %, 2 %, 3 % ω/ω), from the calibration samples of the continuous production. A previous verification of the nominal percentage concentration was carried out with the reference method as described in section 2.3.1. Tablet samples of the test runs were then scanned with the same configuration: three tablets were tested from 10-min samplings. The same spectra employed for the univariate model were also used as the dataset for the development of a multivariate partial least squares (PLS) (Wold et al., 2001) regression model. This chemometric tool has already successfully been applied by some of the Authors to quantify analytes in the solid phase by spectroscopic data (Melucci et al., 2019). Computations were performed by the software The Unscrambler 10.4 (CAMO, Oslo, Norway). Original spectra were pre-treated with the same Savitzky-Golay first derivative, in this case, to reduce noise effects present on the original spectra due to the scattering interference on the reflectance signal. The model was then applied to predict the same samples tested with the univariate model.
The first step of the present study was to assess the reliability of both batch (B1) and continuous (C1, C2, and C3) processes with respect to the target properties of the tablets. Reliability was assessed by confirming the expected weight, set at 240 mg, and the percentages of riboflavin, which in all cases was 2 %(ω/ω). The riboflavin concentration was evaluated by UV–Vis spectroscopy in transmission mode, used as a reference method. The regression line obtained from standard solutions (Section 2.3.2) had intercept 0.2 ± 0.1, slope 3.06 ± 0.03 (significance 5%), R2 0.9997, and RMSE 0.08. The concentration results, obtained in this first step, were then used to validate the further reflectance analyses. Figure 1 a shows the mean weight values over the 20 tablets analyzed for each sampling. For the continuous run, it is possible to observe a perfect alignment of the longer tests (C2, C3) to the target value of 240 mg, while the C1 run (blue) shows a higher variability, particularly at the beginning. This test was performed at first and it was used to set the parameters of the tablet press. These presented a self-regulating system based on the compaction force to guarantee the correct dosing, and thus required initial optimization to define the force corresponding to the desired dosing. The weight fluctuations are due to this operation that, as the C2 and C3 results show, ultimately were correctly defined, and allowed to reach the target value and maintain it until the end. The batch run (B1), instead, shows higher variability; this result can be traced back to a difficulty encountered in maintaining a constant flow, due to the poor flowability of the blend with the batch setup, where the mixture was poured manually through the chute of the tablet press. Figure 1b shows the results, for the assessment of the riboflavin concentration, of UV–Vis analyses of tablets for the 20-min samplings. Only the short continuous run C1 (blue line) was tested every 10 minutes, to guarantee an analogous monitoring of the process. The expected concentration (2% ω/ω) is reported by the red dashed line. The figure shows that all the mean values (calculated from three tablets of each batch, each one analyzed in triplicate) are inside the ± 15% range (black dashed lines) accepted by the pharmacopeia (Kupiec et al., 2008) and only the sampling at time 0 for the B1 run (green line) had a result slightly over the 2.3 % concentration accounted for by the standard deviation.
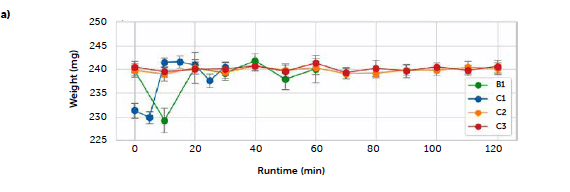

Figure 1: physical characteristics of the tablets along the process evolution: a) tablet weight; b) riboflavin concentration (in %. ω/ω). Results are reported for the batch test (B1, green line) and the three continuous tests (C1, C2, and C3, blue, orange, and red lines respectively). Dashed lines represent the target concentration (red) and the ± 15 % limit (black).
The continuous trials appear closer to the target concentration compared to the batch reference test, with lower mean values of all samplings except for the last sample of the C3 run (red line) and the second hour of the first long trial C2 (orange line), that reported an increase in concentration after 60 minutes of production, kept constant until the end. An explanation of these irregularities can be found in the data of the dosing operation. Figure 2 reports the feeding rate of the feeder LIW3, containing the lubricant MgSt, during trials C2 (a) and C3 (b) respectively. The deviation from the target dosing rate is considered acceptable for this test. The C2 run shows an important fluctuation
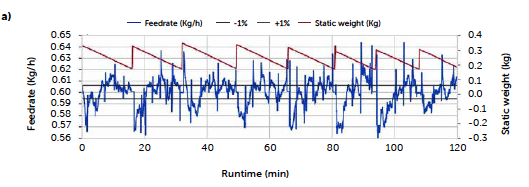
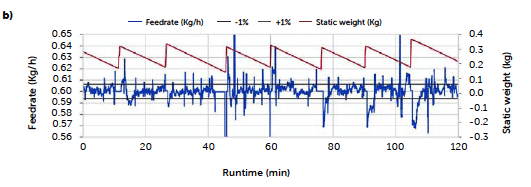
Figure 2: Magnesium stearate feeding rate along the runs C2 (a) and C3 (b).
of the feeder rate outside the control region during the entire run, especially compared to the profile of the C3 run. The dark red line on the plot represents the weight of the product inside the hopper and allows one to follow the refill operation, corresponding to the sharp increase in weight. For the C2 run, larger deviations of the feed rate are recorded immediately after the refill operations and appear more intense in the second hour of production.
A decrease in the feeding rate of the lubricant is consistent with the increase in the percentage of the API observed in the tablets for the C2 run. On the other hand, the C3 run presented a more controlled feeding profile and resulted in a steadier tablet concentration. The refill operation is probably the most delicate phase of continuous feeding, and the magnesium stearate is an ingredient that requires particular attention during this operation, being characterized by very low flowability and a tendency to form bridges and aggregates. It needs to be poured slowly to aerate the powder and avoid packing. During this experiment, the operation was carried out manually and, therefore, subject to a certain degree of variability. The two profiles reflect how an optimization of this phase of the process can impact and can be observed in the final product.
The higher concentration recorded for the 120-min sampling of the C3 run is also explained through the feeding rate data. In this case, the anomaly concerns the riboflavin dosing profile, as reported in Figure 3.
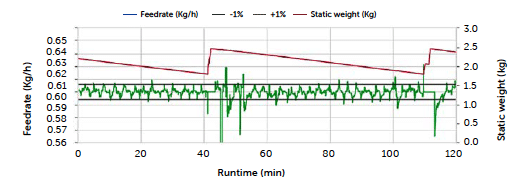
Figure 3: Riboflavin feeding rate for the C3 run.
The feeding rate appears stable and contained within the ± 1% deviation during the entire run, except for a drop at about 45 minutes, corresponding to a brief pause in production, and a stationary trend between 110 and 113 minutes matching the last refill. The experimental tablet concentrations reflected correct dosing until the last sampling following the last refill. The irregularity in this case may be ascribed to the duration of the manual refill, which required the disconnection of the gravimetric control and was completed in about 3 minutes. The absence of gravimetric control during this phase could be responsible for the increase in API concentration recorded for the final sampling. In summary, the continuous line tested in the present study showed comparable results to the traditional batch approach, considering tablet API concentration and weight. A correlation between deviations in the feed rate and change in concentration was found, suggesting the dosing data to be an important diagnostic element of the process. Therefore, an understanding of its variations, together with the implementation of limits and a discard operation, is essential to the control strategy. This is an example of how Continuous Manufacturing, by its automation, can offer more constant monitoring of the process to the benefit of final product quality.
The calibration line computed for the transmission method was also applied to validate the concentrations of the calibration tablets produced in continuous (Section 2.2.2), that have been used to create the calibration model for the reflectance method. Table 1 shows that all predicted riboflavin concentrations are not significantly different from the expected ones (at a significance level of 0.05).
| Tablet | Expected concentration | ||
| 1% | 2% | 3% | |
| 1 | 1.06 ± 0.06 | 2.04 ± 0.08 | 3.2 ± 0.1 |
| 2 | 1.07 ± 0.06 | 2.02 ± 0.08 | 3.2 ± 0.1 |
| 3 | 1.05 ± 0.06 | 2.07 ± 0.08 | 3.0 ± 0.1 |
| Average | 1.06 ± 0.03 | 2.04 ± 0.05 | 3.1 ± 0.2 |
Table 1: Riboflavin concentrations, with the corresponding absolute error (at 5% significance level), predicted by the transmission method for the three calibration runs.
Therefore, the nominal concentrations of the tablets (1 %, 2 %, and 3 %) have been used for further analyses.
In order to use reflectance spectroscopy for a direct quantification of riboflavin in the solid tablets, the first issue to be solved was to identify a characteristic signal of riboflavin, with the aim of using its area for a univariate analysis. Therefore, spectra of each ingredient in powder form were acquired as described in section 2.3.2. The obtained spectra are reported in Figure 4a, where a drop of the riboflavin UV-reflectance curve (orange line) can be observed around 580 nm. Such a drop is absent on the excipient profiles, therefore, it can be considered characteristic of riboflavin. In Figure 4a the spectrum of the 2% mixture is also reported (red line), presenting an analogous signal at 580 nm.
Based on these preliminary tests, the spectra of tablets at different riboflavin concentrations were acquired. Figure 4b shows the characteristic signal of riboflavin, previously identified, which changes according to analyte concentration: orange, blue, and green curves in the upper plot represent the three riboflavin concentrations (1 %, 2 %, and 3 %ω/ω respectively), and their slopes increase in agreement with riboflavin concentration, corresponding to higher absorption of radiation. The Savitzky-Golay first derivative of the reflectance spectra, shown in the lower part of Figure 4b, converts the drop into a characteristic peak of the analyte, whose area increases with concentration. This result allowed for the calculation of a univariate quantitative model, using the areas as the response.
The presence, in this case, of a distinct drop of the analyte signal in the visible range is due to the orange color of riboflavin, which accounts for the reflectance of the lower frequency corresponding to the red/orange radiation and the absorption in the blue/green range. On the contrary, the excipients, all white powders, reflecting the entire visible range, presented more distinct trends in the UV region. Since, typically, APIs are organic compounds with specific absorption in the UV range, in a real case it would be more complex to identify a characteristic signal of the analyte without overlaps on the excipients’ signals.
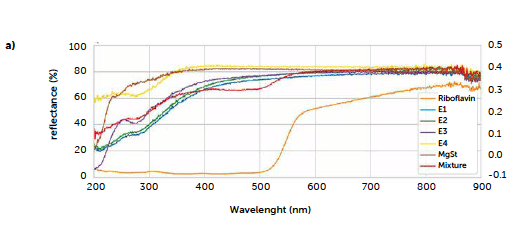
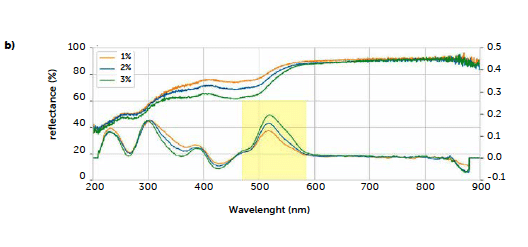
Figure 4: UV–Vis reflectance spectra of a) tablet ingredients and mixture (red line); b) tablets of the three calibration runs (upper portion: original spectra; lower portion: derived spectra). The yellow rectangle indicates the peak, in the derived spectra, used for univariate calibration, between 470 and 585 nm.
In these cases, different strategies can be tested, as, for example, using a blank tablet (produced with all the excipients, in the proper dosage, but without the API) for the baseline correction, to subtract the contribution of the excipients to the spectra, and/or develop a multivariate model able to use the full spectra profiles. In this study, we tested both these options as examples of possible applications. Figure 5 shows the effects on the spectrum of a baseline correction using a blank tablet of the same formulation excluding the analyte (blue line). On the same graph, the spectrum resulting from the zeroing with the BaSO4 reference blank, provided with the instrument, is reported (orange line).
From the blue profile of Figure 5, it can be observed how the correction with the blank tablet reduces the contribution of the excipients from the final portion of the spectrum: the signal in the UV region returns to high values of reflectance, since the main contribution to the absorption in this range, due to the excipients, has been removed.
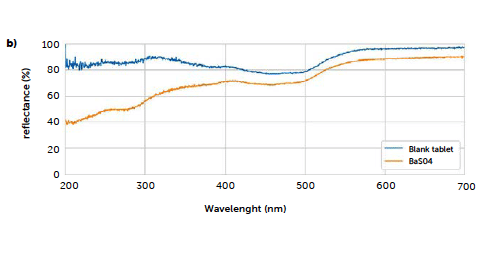
Figure 5: comparison of the UV–Vis reflectance baseline obtained with a blank tablet and the standard BaSO4.
The exclusion of the excipients’ signal contributions is not absolute, and an increase in the signal noise is observed. However, this simple procedure can help to sharpen the analyte signal when present in this range.
585 nm in the derived spectra, allowed for the development of a univariate model. Due to the absence of standards, the samples used to compute such a model are the tablets produced in continuous (section 2.2.2) with different riboflavin concentrations (1 %, 2 %, and 3 %ω/ω), that were validated by the transmission method, as reported in section 3.1. The obtained egression line has intercept 8.8 ± 0.6, slope 4.8 ± 0.3 (significance 0.05), R2 0.990, and RMSE 0.2. The regression model was then applied to predict the riboflavin concentration of three replicates (tablets) for each 10-min sampling of the two long continuous runs (C2, C3) and the B1 batch run. The mean results are reported in Figure 6 and compared with those obtained with the reference liquid method (although it was applied for 20 minutes samplings). For the two continuous runs (Figure 6b, 6c), it is possible to observe high similarities between the results of the two methods: considering the standard error (calculated from the replicates) of both methods, only the samplings at 80 and 120 min of C2 run differ significantly between the two techniques.
For the C3 run, the highest difference is observed for the 80-min sampling, comparable to the model RMSE (0.1–0.2 %ω/ω). The last comparison is referred to the B1 batch run (Figure 6a). In this case, all the predicted concentrations with the reflectance method show a significant negative offset from the values obtained with the solution method, with the exception of the first sampling. A possible cause for this result can be found in the different tablet hardness produced by batch and continuous productions. This property was not chosen as a primary quality attribute for the comparison and, therefore, it was not optimized during setup or monitored during production. Although the rotatory press settings were identical for both batch and continuous runs, the physical analysis, (section 2.3.1) revealed a mean hardness value for the batch tablets of 70 N, against the 90 N of the tablets produced with the continuous method.
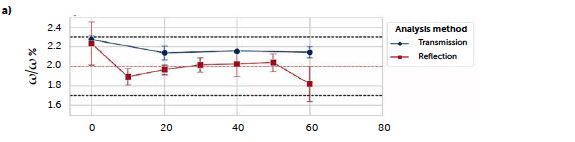
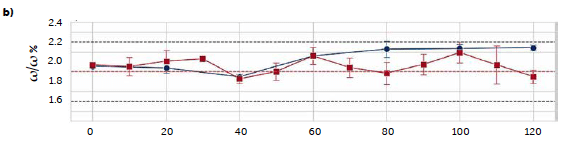
Figure 6: comparison of the predicted riboflavin concentrations from the two univariate UV–Vis methods: transmittance (blue solid line) and reflectance (red solid line). Results are reported along the three processes B1 (a), C2 (b), and C3 (c). Dashed lines represent the target concentration (red) and the ± 15 % limit (black).
Since the mechanical setup was not changed, it is possible that the cause was a difference in the compressibility of the mixture, due to a slight difference in the physical properties of the raw materials occurring between the trials that were carried out within one month of each other.
The hardness reflects the level of compression of the powder that influences the rearrangement and deformation of the particles inside the tablet as well as the surface morphology (Aulton and Taylor, 2013), and both properties affect the reflection of radiation. The sensitivity of the quantitative reflectance methods with respect to tablet hardness has been reported in other publications (Pawar et al., 2016; Baranwal et al., 2022). Since the model used for the prediction was computed exclusively with tablets from continuous methods, it is plausible that the lower hardness of the batch samples introduced a systematic error in the predictions.
To test a more general approach, potentially applicable also when it is not possible to identify a characteristic signal of the analyte, we computed a PLS model correlating the entire reflectance-spectral profile to the riboflavin concentration. The best model was obtained from derivative spectra considering three PLS factors. In this case, the 1st-degree Savitzky-Golay derivation was a useful pre-treatment to reduce the noise due to scattering effects, very common with reflectance signals. Figure 7 shows the loadings plot for the first three PLS factors of the derived model (b) compared to the analogous model obtained with the untreated spectra (a). For the untreated spectra, the second and third factors, while still containing information about the signal, shown by the values of the more relevant loadings associated with the wavenumbers around 520 nm, present a variability that can be associated with background noise, which is absent after the derivation. This is reflected also in the predictive performance of the models: comparing the model obtained with the original spectra (Figure 7c) to the one from the derivate spectra (Figure 7d), R2 increases from 0.986 to 0.992, while RMSE decreases from 0.102 to 0.0795. Figure 8 shows the concentrations predicted for the same tablets tested with the univariate model, whose results are also reported for comparison (green line).
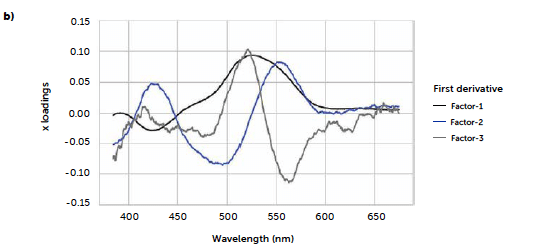
Figure 7: comparison between PLS models carried out with original UV–Vis reflectance spectra (left portion) and spectra pre-treated with Savitzky-Golay 1st derivative (right portion). Loadings plots (a and b) and parity plots (c and d) are reported.
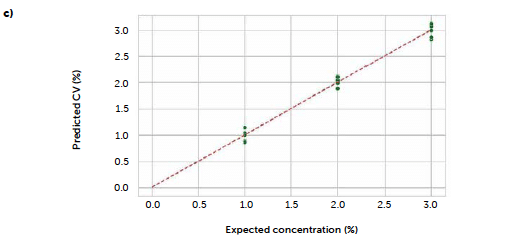
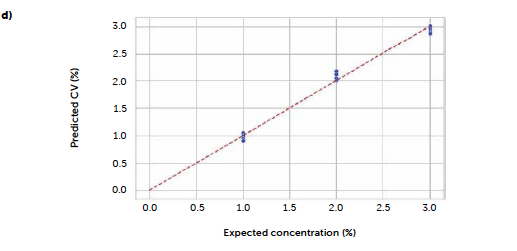
Figure 8: comparison between PLS models carried out with original UV–Vis reflectance spectra (left portion) and spectra pre-treated with Savitzky-Golay 1st derivative (right portion). Loadings plots (a and b) and parity plots (c and d) are reported.
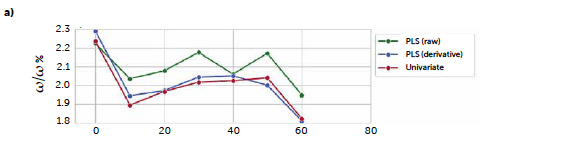
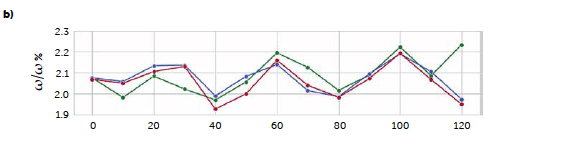
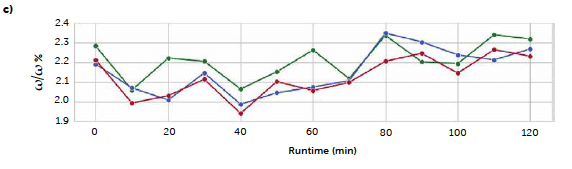
Figure 9: comparison of the predicted riboflavin concentrations from UV–Vis reflectance methods: univariate (red line), PLS carried out with original spectra (green line), and PLS with Savitzky-Golay 1st derivative (blue line). Results are reported along the three processes B1 (a), C2 (b), and C3 (c).
Since, in this case, the spectra presented a sharp signal of the analyte, we expected a good accordance between the PLS and the univariate prediction, and the trends of the mean values confirm a good agreement between the univariate and the PLS results from the derived spectra, with only a significant difference for the samplings between 80 and 100 minutes in C3 run. The untreated spectra model, instead, shows a more variable trend compatible with a greater presence of noise, as observed in the loadings plot. 4.
A test study for the production of a pharmaceutical formulation was carried out using riboflavin as a proxy of an active pharmaceutical ingredient (API), at concentration of 2% (ω/ω), but with a real industrial formulation. The primary aim of the study was to compare the production processes using a classical batch process and an alternative continuous process. The tablets produced by the two methods were evaluated in terms of physical properties (few samples had a weight different from the expected one of 240 mg) and concentration of riboflavin in the tablets. Very good results were achieved, because no significant differences were observed in riboflavin concentration between the tablets obtained by the two processes, neither considering the evolution over time of the processes. Indeed, none of the riboflavin concentrations predicted by the models overcame the range recommended by pharmacopeia 1.7–2.3% (ω/ω) (corresponding to a tolerance level of ± 15% on the 2% (ω/ω) nominal value). These results suggest that the continuous method is equivalent to the batch one and, moreover, it reduces time and costs of production. Moreover, an innovative analytical method was proposed, using reflectance UV–Vis spectroscopy for the API quantification, comparing it to the transmittance method. No significant differences were observed in riboflavin concentration prediction between the two methods (transmittance and reflectance mode, respectively) in univariate mode. The same comparison was also proposed by a multivariate analysis, using full reflectance spectra as input data. The PLS model calculated with full spectra, pretreated with first derivative, showed a very good R2 of 0.992 and a RMSE of 0.0795, with predicted riboflavin concentration that, also in this case, never overcame the acceptability range. Although, in the present work, such method was applied on a colored substance, used as a proxy of API, for which a characteristic signal is present in UV–Vis spectra, the use of multivariate analysis on the entire spectrum can overcome the drawback of the need of a specific signal for the API of interest. The advantage of reflectance spectroscopy is that the analysis is carried out on the solid sample, without the need for any chemical pretreatment, saving time and chemicals. We believe that, with the advancement of proper technologies, such reflectance methods may be used also in-line, for the evaluation of the process while it is running.
References
[1] “ICH_Q13_Step4_Guideline_2022_1116.pdf.” Accessed: Apr. 25, 2023. [Online]. Available: https://database.ich.org/sites/default/files/ICH_Q13_Step4_Guideline_2022_1116.pdf.
[2] Aulton, M.E., Taylor, K., 2013. Aulton’s pharmaceutics: the design and manufacture of medicines. Elsevier Health Sciences.
[3] Baranwal, Y., Rom´an-Ospino, A.D., Li, J., Razavi, S.M., Muzzio, F.J., Ramachandran, R., Mar. 2022. Prediction of entire tablet formulations from pure powder components’
[4] Baranwal, Y., Rom´an-Ospino, A.D., Li, J., Razavi, S.M., Muzzio, F.J., Ramachandran, R., Mar. 2022. Prediction of entire tablet formulations from pure powder components’ spectra via a two-step non-linear optimization methodology. Int. J. Pharm. 615, 121472 https://doi.org/10.1016/j.ijpharm.2022.121472.
[5] Baranwal, Y., Rom´an-Ospino, A.D., Li, J., Razavi, S.M., Muzzio, F.J., Ramachandran, R., Mar. 2022. Prediction of entire tablet formulations from pure powder components’ spectra via a two-step non-linear optimization methodology. Int. J. Pharm. 615, 121472 https://doi.org/10.1016/j.ijpharm.2022.121472.
[6] C. for D. E. and Research, “News from ETP,” FDA, Feb. 2023, [Online]. Available: https://www.fda.gov/about-fda/center-drug-evaluation-and-research-cder/newsetp.
[7] Chauhan, R., Kumar, R., Kumar, V., Sharma, K., Sharma, V., Feb. 2021. On the discrimination of soil samples by derivative diffuse reflectance UV–vis-NIR spectroscopy and chemometric methods. Forensic Sci. Int. 319, 110655 https://doi. org/10.1016/j. forsciint.2020.110655.
[8] Chong, X.-M., Zou, W.-B., Yao, S.-C., Hu, C.-Q., May 2017. Rapid analysis of the quality of amoxicillin and clavulanate potassium tablets using diffuse reflectance nearinfrared spectroscopy. AAPS PharmSciTech 18 (4), 1311–1317. https://doi.org/10.1208/s12249-016-0602-3.
[9] Dalvi, H., et al., Apr. 2019. In-line monitoring of ibuprofen during and after tablet compression using near-infrared spectroscopy. Talanta 195, 87–96. https://doi.org/10.1016/j.talanta.2018.11.034. [10] Engisch, W., Muzzio, F., Mar. 2016. Using residence time distributions (RTDs) to address the traceability of raw materials in continuous pharmaceutical manufacturing. J. Pharm. Innov.
11 (1), 64–81. https://doi.org/10.1007/s12247-015-9238-1. [11] Fonteyne, M., et al., Apr. 2015. Process analytical technology for continuous manufacturing of solid-dosage forms. TrAC Trends Anal. Chem. 67, 159–166. https://doi.org/10.1016/j.trac.2015.01.011.
[12] Gotardo, M.A., Tognolli, J.O., Pezza, H.R., Pezza, L., Apr. 2008. Detection of propranolol in pharmaceutical formulations by diffuse reflectance spectroscopy. Spectrochim. Acta A Mol. Biomol. Spectrosc. 69 (4), 1103–1109. https://doi.org/10.1016/j.saa.2007.06.010.
[13] Gouveia, F.F., et al., Jan. 2017. Using PAT to accelerate the transition to continuous API manufacturing. Anal. Bioanal. Chem. 409 (3), 821–832. https://doi.org/10.1007/s00216-016-9834-z. [14] Guio, L.L.M., Coutinho, L.O., Cavalcante, V., Ferreira, A., Amorim, Z.B., Ribeiro, J.S., Sep. 2021. Prediction of caffeine in tablets containing acetylsalicylic acid, dipyrone, and paracetamol by near-infrared spectroscopy, Raman scattering, and partial least squares regression. J. Appl. Spectrosc. 88 (4), 772–780. https://doi.org/10.1007/s10812-021-01239-8.
[15] “ICH Official web site : ICH.” [Online]. Available: https://www.ich.org/page/qualityguidelines. [16] Ierapetritou, M., Muzzio, F., Reklaitis, G., Jun. 2016. Perspectives on the continuous manufacturing of powder-based pharmaceutical processes. AIChE J. 62 (6), 1846–1862. https://doi.org/10.1002/aic.15210.
[17] Islam, K., Singh, B., McBratney, A., 2003. Simultaneous estimation of several soil properties by ultra-violet, visible, and near-infrared reflectance spectroscopy. Soil Res. 41 (6), 1101–1114. https://doi.org/10.1071/sr02137.
[18] Kessler, W., Oelkrug, D., Kessler, R., May 2009. Using scattering and absorption spectra as MCR-hard model constraints for diffuse reflectance measurements of tablets. Anal. Chim. Acta 642 (1–2), 127–134. https://doi.org/10.1016/j.aca.2009.01.057. Kupiec, T.C., Vu, N., Branscum, D., 2008. Quality-control analytical methods: homogeneity of dosage forms. Int. J. Pharm. Compd. 12 (4), 340–343.
[19] Lee, S.L., et al., Sep. 2015. Modernizing pharmaceutical manufacturing: from batch to continuous production. J. Pharm. Innov. 10 (3), 191–199. https://doi.org/10.1007/s12247-015-9215-8.
[20] Melucci, D., Zappi, A., Poggioli, F., Morozzi, P., Giglio, F., Tositti, L., 2019. ATR-FTIR spectroscopy, a new non-destructive approach for the quantitative determination of biogenic silica in marine sediments. Molecules 24
(21), pp. https://doi.org/10.3390/ molecules24213927.