
In this case study of tableting control, the purpose is to evaluate potential mixing trouble through MicroNIR probes.
NIR spectroscopy as real time control tool for tablets manufacturing
Introduction
Oral solid dosage (OSD) forms remain a popular choice for both pharmaceutical companies and patients. Convenience, ease of manufacture and administration, increased stability, and simplicity for pack and transport – compared with alternative dosage forms – are some of the factors leading to the continued popularity of OSDs. [1] As tablets comprise a significant proportion of OSD forms, within the pharma industry, tools able to support in formulation and manufacturing efficiencies are of critical importance.
One of them is near-infrared (NIR) spectroscopy sensor, applicable in tablet formulation and manufacture. NIR spectroscopy can be used in every step of tablet formulation and manufacturing process. For example, NIR is useful for raw material identification, blend homogeneity, tablet characterization, and process end-points determination in pharmaceutical manufacturing.
In a Quality by Design/PAT approach, using specialized sensors as MicroNIR placed in accessible area of tablet-press, can deliver real-time data about chemical and physical attributes of the raw materials, intermediate or final
products.
In this case study of tableting control, the purpose is to evaluate potential mixing trouble using three different formulations through MicroNIR probes positioned on the loading system pipe (Figure 1) of industrial rotary tablet press.
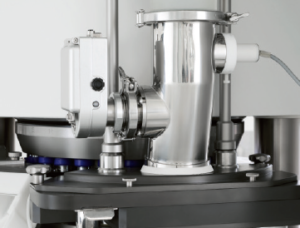
Figure 1: NIR application on loading system pipe of Prexima 300.
Materials and methods
Three formulations were studied: all containing Lactose Monohydrate (Tablettose 80, Meggle) as filler, talc (Imerys) that simulates API and magnesium stearate as lubricant (Baerlocher). Talc content was varied in the range from 1% (formulation 1) to 3% (formulation 2) and 5% (formulation 3) (Table 1).
| Compounds | Formulation 1 [%] | Formulation 2 [%] | Formulation 3 [%] |
| Lactose Monohydrate | 98 | 96 | 94 |
| Talc | 1 | 3 | 5 |
| Magnesium stearate | 1 | 1 | 1 |
Table 1: quantitative and qualitative composition of formulations used.
Formulation 2 represents the theoretical/ideal target that one manufacturer already knows, while the others simulate potential deviations from correct blending process (e.g. segregation or demixing): if talc is not distributed at its best, MicroNIR probe could detect lower (1%) or higher (5%) concentration.
The equipment used was Prexima 300 (IMA, Italy) equipped with 27 stations Euro-D turret and Euro-D 9 mm round biconvex punches. The optimized feed frame together with the dosing mechanism of the turret, fills with high precision each matrix. Sensor used was MicroNIR PAT-W® (VIAVI) positioned on loading system pipe. All the experiments were performed applying same process parameters, loading continuously powder and acquiring on-line spectra thanks to the sensor. Data were first pre-processed for better interpretation and then treated with chemiometric algorithms: the most popular are Moving Block (MB) and Principal Component Analysis (PCA). Pre-processing of NIR was performed to remove physical phenomena in the spectra in order to improve data information decreasing random noise.
For the first analysis after pre-processing, Moving Block algorithm (MB) was applied to observe if there was some clear variations that allow the operator to understand that process is shifting from a state of control. In particular, it consists in summarizing variance in blocks of spectra collected over the time course of the process. The analysis of the principal components (PCA) is the most important technique for the data exploration among multivariate analysis (MVA). It is a technique that is based on finding the direction in multivariate space, specifically it consists on transforming the original variables in new ones perpendicular to each maximizing the variance.
Results and discussion
For each formulation, spectra were acquired over the time continuously while the blends were loaded in the hopper (Figure 2).
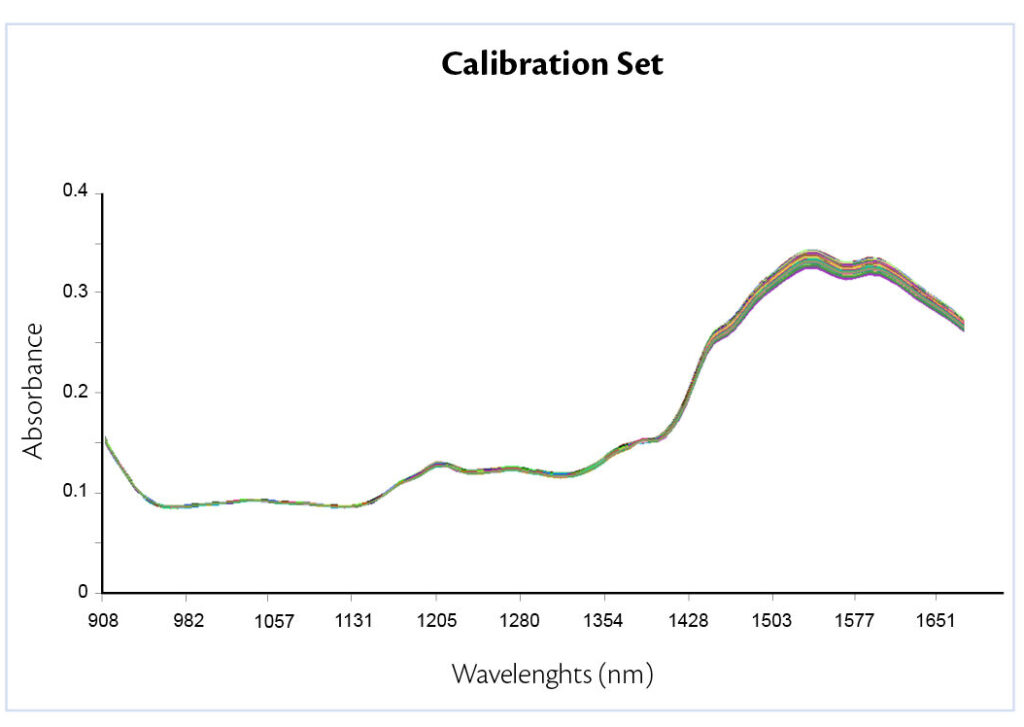
Figure 2: all-in raw spectra of the three formulations.
In this work, pre-processing techniques applied were first derivative, to correct the base line off set and SNV, to reduce the physical variability between samples due to scatter. Results show a peak variation where talc usually absorbs, confirming the presence of different excipient concentration (Figure 3).
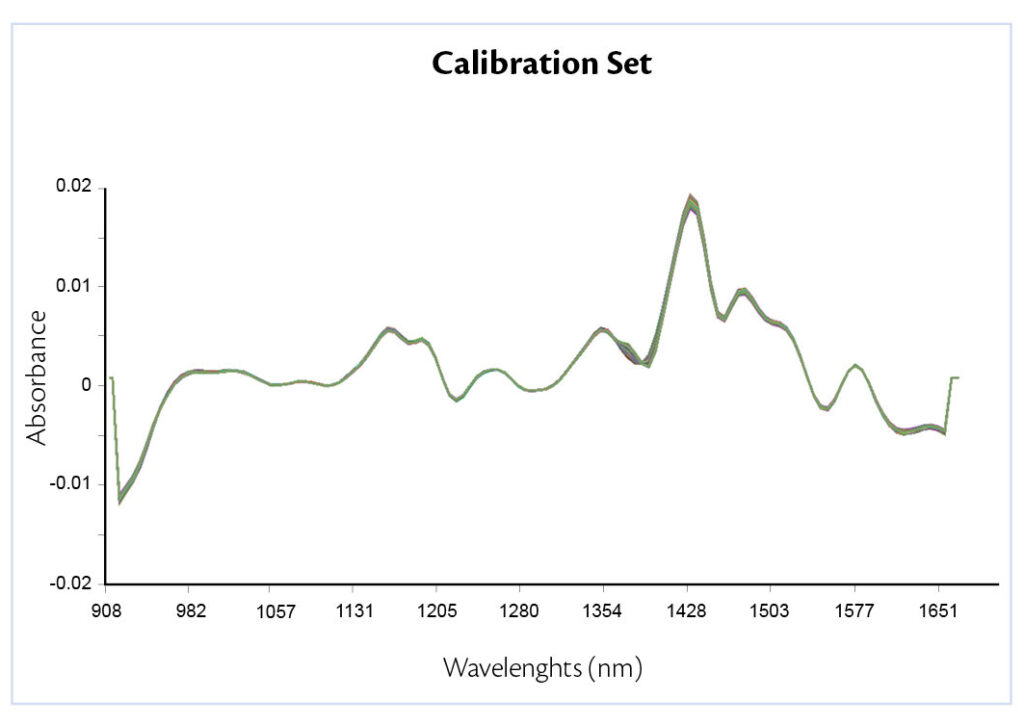
Figure 3: pre-processed data acquired.
The real data interpretation is focused on MB and PCA. The first method calculates the area below each spectra and the resulting value is compared with
the other one inside the same block. For each block, the software quantify the mean and the standard deviation. Every time a new spectra is generated, the oldest one is kept out from the block. This creates a behavior over the time typical of the material flowing in front of the NIR sensor.
Three different peaks are clearly recognizable (Figure 4), they represent the mixture with a different concentration flowing in front of the sensor.
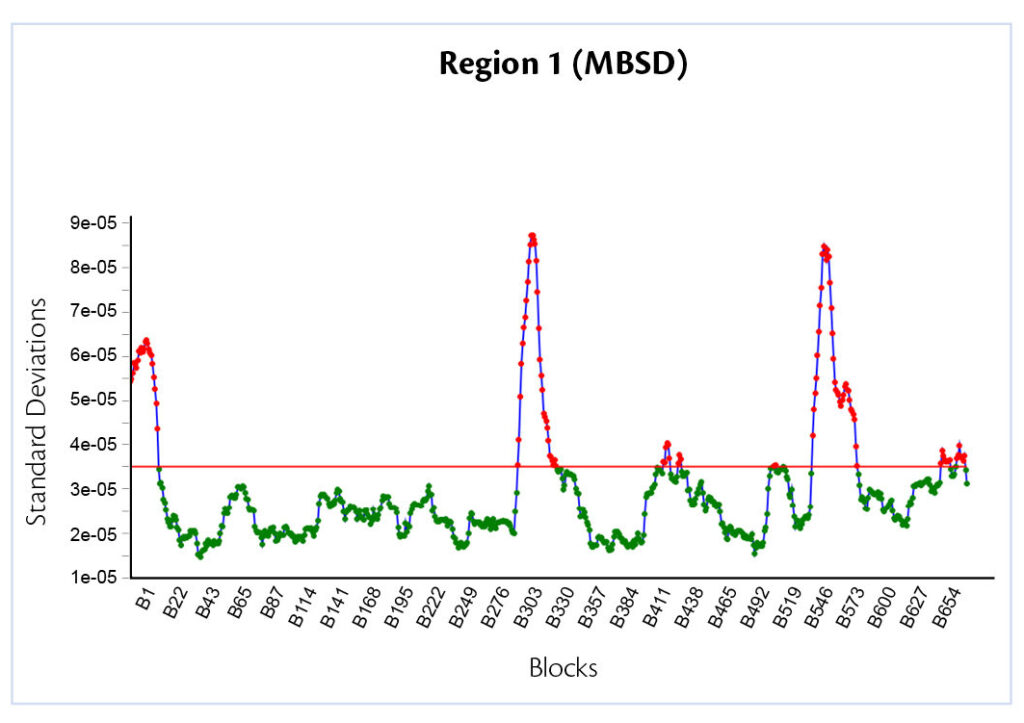
Figure 4: Moving Block Standard Deviation.
Respectively 1%, 3% and 5% of talc. This happens because the shape of each spectra is strictly correlated to the mass concentration of the excipients: for this reason, when a blend with different characteristics to the previous one flows, standard deviation will be completely different because the ratio between the compounds is changing. The value of SD returns inside the limits only when the last spectra referred to the previous talc concentration goes out from the block.
This fact is even more visible in the Moving Block Mean plot (Figure 5).
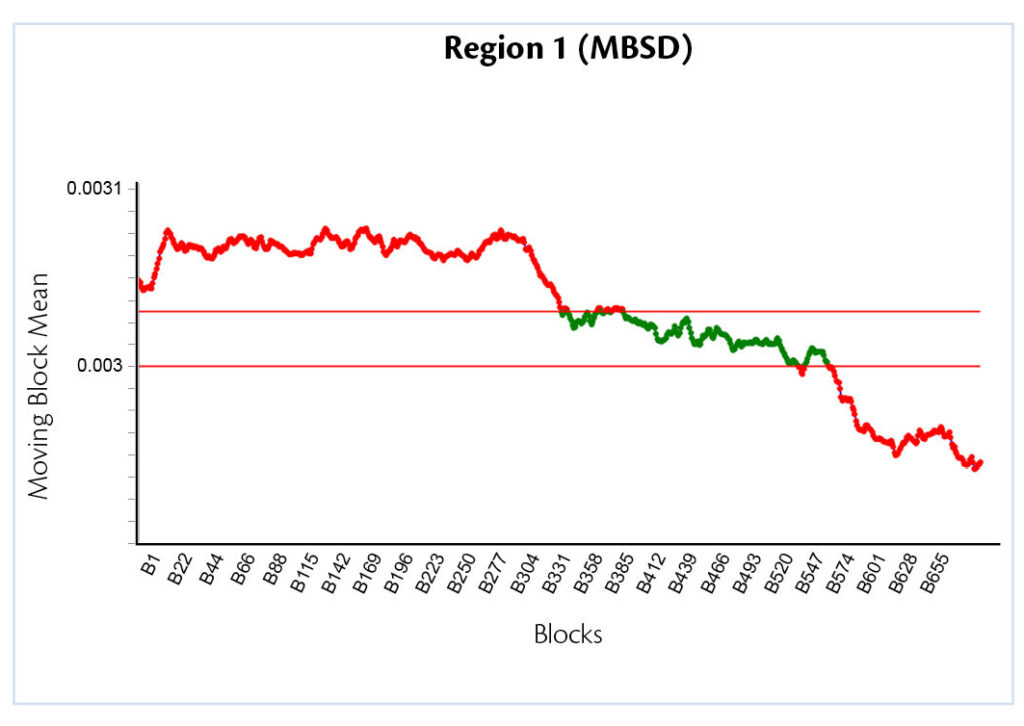 Figure 5: Moving Block Mean.
In this case the mean is calculated among the values of areas under the spectra curve for each block. Three different plateau are recognizable and correspond to the three different talc concentrations. Thanks to the gold standard, it is well-known the value of the average mean block (talc 3%). Everything that is out-of specifications will correspond to different excipient ratio, talc in this case.
The other data analysis technique is PCA. It leads the possibility to deeply understand where the variability is concentrated analyzing both loadings and scores plot. Loading plot (Figure 6) confirms that the most variability is due to talc concentration because the peak shown is in correspondence of talc absorption.
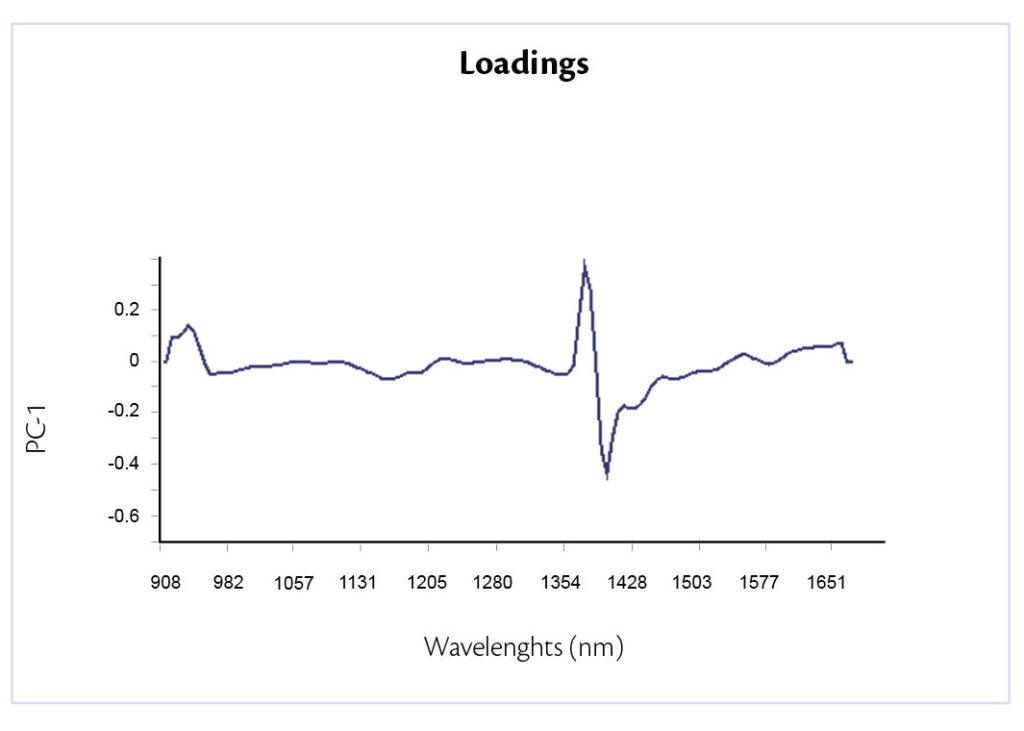 Figure 6: loading plot.
Moreover, the scores plot (Figure 7) shows three different steady state conditions that correspond to the three different formulations studied.

Figure 7: scores plot.
To confirm again the thesis, in the graph it is possible to identify that the shift in concentration is detected: every formula was loaded in tablet press after the same number of spectra acquired (300) over the time. The plot shows that after 300 spectra the variation takes place. This allows the operator to control if the process drifts out from the stability.
Conclusions
The introduction of a MicroNIR probe, positively confirms the possibility to monitor in real time process shift, observing indirectly up-stream tableting process (e.g. dispensing, blending, granulation). In addition, applying correct chemiometric algorithms, it is possible to detect the different formulations studied and the precise moment when they were loaded in tablet press, thus leading to an optimal check of powder segregation or change in its characteristics. This instrument, included in the control strategy, confirms the well-known features of Prexima series allowing to guarantee the process consistency. This is suitable for continuous tableting process where the blend is constantly monitored assuring the final quality required and avoiding out-of-specifications situations.
References
[1] Future Market Insights, Oral Solid Dosage Pharmaceutical Formulation Market: Emerging Markets of Latin America, APEJ, and MEA to Collectively Hold over 45% Market Value Share: Global Industry Analysis 2012–2016 and Opportunity Assessment 2017–2027, futuremarketinsights.com, Market Report, 18 July 201.
[2] A. Rinnan, F. Van Den Berg, S. B. Engelsen, Review of the most common pre-processing techniques for near-infrared spectra, “Trends in Analytical Chemistry” (2009), pp. 1201-1.
[3] Q. Su et all., A prospective on Quality-by-Control (QbC) in pharmaceutical Continuous Manufacturing, “Computer and Chemical Engineering”, 125 (2019), pp. 216-231.
[4] Q. Su et all., Variation and Risk Analysis in Tablet Press Control for Continuous Manufacturing of Solid Dosage via Direct Compression, International Symposium on Process Systems Engineering, PSE 2018.
[5] F. Giatti, Application of NIR spectroscopy for tablets manufacturing control, 2019, https://ima.it/pharma/application-of-nir-spectroscopy-for-tablets-manufacturing-control/


