Pharmakeyboard_arrow_rightMiniaturized near infrared spectroscopy applied for a non-destructive uniformity and quantification tracking of magnesium stearate during processing
menu

Tumbler blending case study.
In all the manufacturing fields of oral solid dosage forms, powder blending represents a critical step for ensuring the blend uniformity of the final product [1]. The raw material particle properties, blender geometry, blending time, filling and rotation speed are the main factors to consider for achieving the optimal blending process efficiency. Besides other compounds, which comprise the final formulation, lubricants are essential to ensure the success of the manufacturing since many failures are caused by issues related to lubrication. Albeit a fairly small amount is used (0.25%-5.0% w/w), lubricants play important roles because can act in three roles as an excipient: true lubricant, anti-adherent or glidant. As a true lubricant, it reduces the friction between the solid product and the metallic machine surfaces. As an anti-adherent, the lubricant reduces the formulation’s stickiness, which also decreases friction. Lubricants can also function as glidants, reducing nterparticle friction in the formulation. A glidant typically forms layers between particle surfaces or at their interfaces and increases the distance between the particles to improve flowability. They consist of long-chain molecules with active end groups, which allows them to be readily adsorbed on the surfaces of particles to form a film, creating boundary lubrication [2]. In this work, according to the FDA’s guideline [3], which encourages the implementation of process analytical technology (PAT) for processing, a miniaturized near infrared spectrometer was applied to monitoring blending of a binary lactose-based placebo mixtures lubricated with magnesium stearate, that probably is the most commonly used excipient as lubricant. The aim was to investigate both uniformity and quantification of such lubricant during a process blending performed in a tumble blender. A preliminary calibration-free, qualitative method (Moving Block Standard Deviation) was used to determine the endpoint, which was afterwards modelled by a quantitative approach (Partial Least Squares).
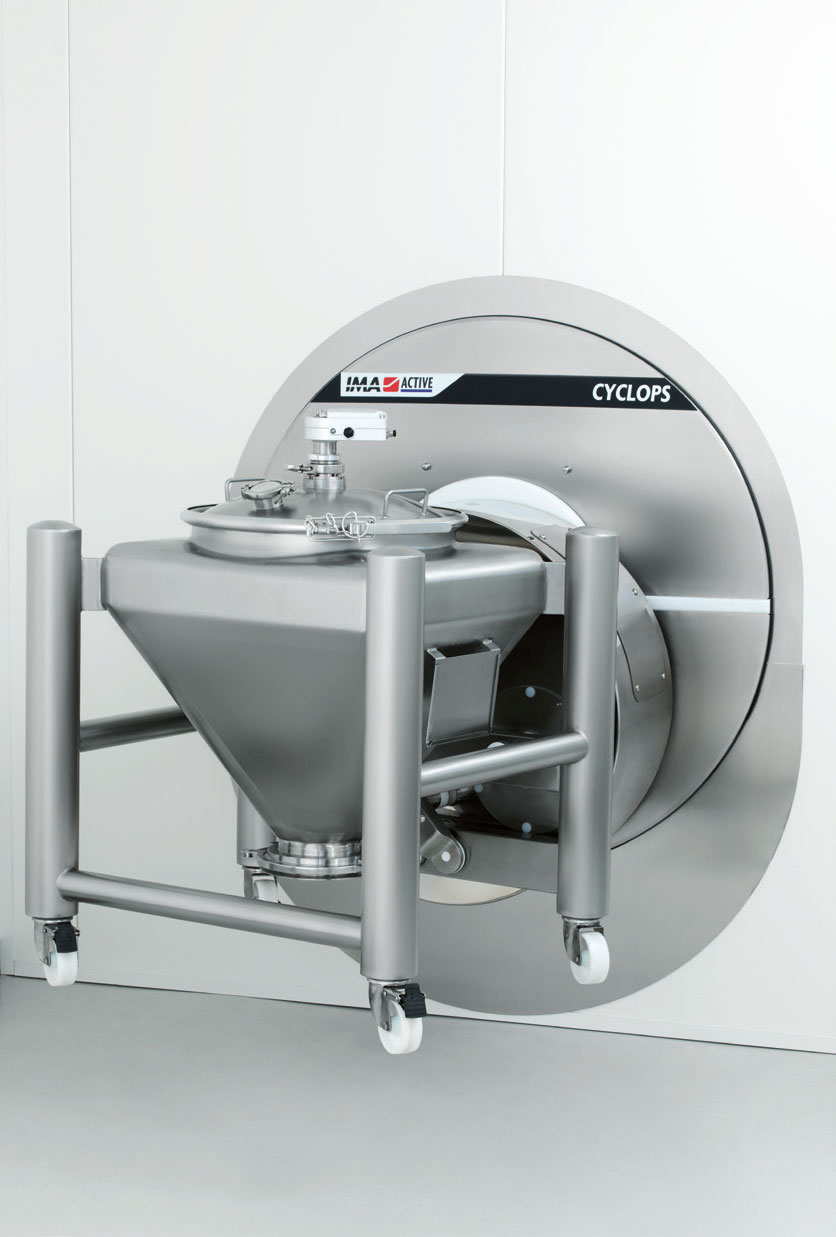
A total of six experimental trials were carried out by using a placebo formulation based on lactose monohydrate (Foremost® NF Lactose 312, USA) lubricated with magnesium stearate (Brenntag, Italy). The mixtures (Table 1) were blended in a tumble blender (Cyclops Lab, IMA), a laboratory scale bin blender equipped with a 15 L bin, which features a maximum filling of 70% of the full container capacity and an adjustable rotational speed between 4 and 20 RPM. The starting batch size was selected according to the lactose monohydrate bulk density of 0.497 g/ml corresponding to the maximum bin filling.
Magnesium stearate was added to the lactose monohydrate by varying the amount from 0.25% up to 5%. Powders were blended by rotating the bin at 10 RPM for 5 minutes by monitoring the lubricant distribution over the time to define the blending end-point. The MicroNIR™ (PAT-W, Viavi, USA) was employed to wirelessly acquire real-time the diffuse reflectance spectra in the wavelength range of 908–1,676 nm.
Thanks to its small size and robustness, the sensor is clamped on the lid of the bin through a dedicated sight-glass flange; its core technology is the novel thin-film linear variable filter (LVF) used as the dispersive element.
| Trial No. | Lactose Monohydrate | Magnesium Stearate | Batch size | ||
| Amount (g) |
Concentration (%) | Amount (g) | Concentration (%) | Amount (g) |
|
| 1 |
5,217.7
|
99.75 |
13.08 |
0.25 |
5,230.8 |
| 2 | 99.50 | 26.22 | 0.50 | 5,243.9 | |
| 3 | 99.25 | 39.43 | 0.75 | 5,257.1 | |
| 4 | 99.00 | 52.70 | 1.00 | 5,270.4 | |
| 5 | 97.00 | 161.37 | 3.00 | 5,379.1 | |
| 6 | 95.00 | 260.93 | 5.00 | 5,478.6 | |
Table 1: blend formulation: lactose (95%-99.75% w/w) and magnesium stearate (0.25%-5.0% w/w).
Figure 1 provides the results of MBSD applied to the acquired data using a block of 10 spectra in the wavelength region between 908.1 and 1,676.2 nm, where each spectrum typically represents a blender rotation (i.e. 1 block represents 10 rotations of the blender or one minute). The blending end-point is determined by repeated low values of variability; when the plateau is reached (B26), the blend uniformity is achieved (after 3 minutes approximately as blending time).
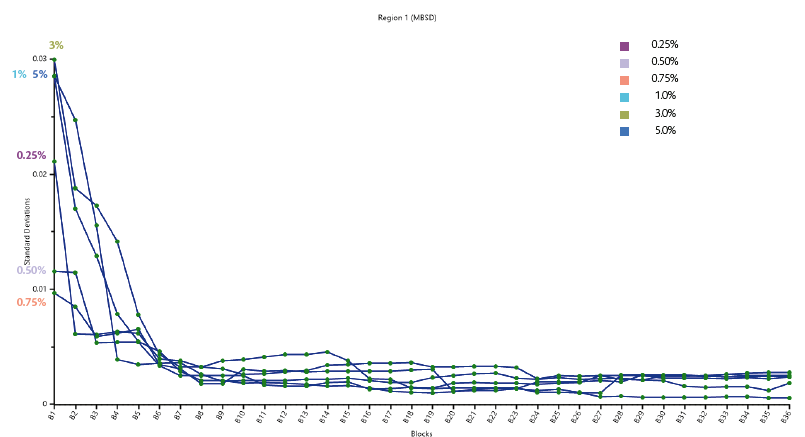
Figure 1: Moving Block Standard Deviation trajectory.
Quantification of magnesium stearate in the final blend
In according to the results obtained by the MBSD approach, a quantitative model was developed considering the average spectrum of the last 15 signals for each of the six trials. The average data were processed by means of two different mathematical transformations such as Standard Normal Variate (SNV) and first derivative [6].
Data pre-treatment is a typical preliminary step of near infrared analysis, which highlights the correlation between spectral information and the species of interest (Figure 2).
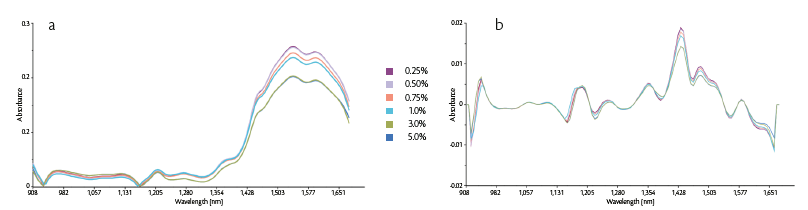
Figure 2: (a) Raw MicroNIR averaged spectra, (b) pre-processed spectra colored according to the amount of magnesium stearate.
The absence of moving parts, the compact optical design and light weight of the MicroNIR allow constant speed rotation (no acceleration/deceleration due to unbalanced weight) small footprint of blender protective shield, if necessary, as well as long term stability, with no need for frequent recalibration [4].
The data processing was performed applying the Moving Block Standard Deviation (MBSD), a qualitative analysis approach that calculates the standard deviation of the acquired spectra across the entire spectral region. MBSD belongs to the family of the calibration-free, unsupervised methods and allows to monitoring the process with no need for prior knowledge of NIR spectra of the analysed matrix, its pure ingredients or relative concentrations. The MBSD approach allows to evaluating the spectral variability in the data set, which provides an indirect measure of uniformity [5]. The trajectory of the MBSD tends to a constant value when the blend gets to be toward homogeneity, which greatly helps identifying the process blending endpoint.
Afterwards, Partial Least Squares (PLS) was applied to the transformed spectra. With no need to specify the region of interest, PLS automatically calculates the correlation between the spectral variance in the data set and the concentration values, resulting in a plot of actual concentration values versus calculated, as well as calibration error.
| RMSE | Slope | Intercept | R2 |
| 0.01477 | 0.99992 | 0.00013 | 0.99 |
| 0.32688 | 1.01067 | 0.08889 | 0.08889 |
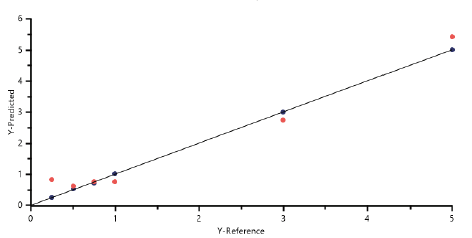
Figure 3: Predicted Vs Reference plot.
The Predicted vs Reference plot compares reference (x-axis) and predicted (y-axis) concentration values of magnesium stearate of both, in calibration (blue dots) and in cross validation (red dots) spectra.
The Predicted vs Reference plot straight line indicates the perfect (i.e.: theoretical) correlation between predicted and measured values, while the dots represent the distance to such ideal correlation of each calibration and validation sample; the closer is the slope to 1, intercept to 0 and correlation (R2) to 1, the higher the robustness of the model.
In particular, the obtained values of root mean square error (RMSE) in cross validations (0.12 with “Leave-one-out”) and R-Square (0.99) show the stability and the reproducibility of the mathematical PLS model.
In conclusion, MicroNIR sensor turned out to be a very powerful tool to determine the process blending end-point and magnesium stearate content uniformity by using a two-compounds placebo lactose-based formulation.
Moving Block Standard Deviation allows to identify the optimal process conditions for an efficient and successful blending in Cyclops tumble blender while the development of a PLS model can be applied at-line for the low-dosed lubricant quantitative determination.
References
[1] Mendez A. S., De Carli G., Garcia C. V., Evaluation of powder mixing operation during batch production: Application to operational qualification procedure in the pharmaceutical industry, “Powder technology”, 198(2), 310-313, 2010.
[2] Carpanzano T., Best Practises for Effective Tablet Lubrication, “JRS PHARMA”, https://
www.tabletscapsules.com/enews_tc/2020/issues/tcnews_08_10_20expert.html
[3] Food and Drug Administration. Process Validation. General Principles and Practices U.S. Department of Health and Human Services (2008).
[4] Macleod H.A., Thin-Film Optical Filters, CRC Press, Boca Raton, FL, USA, pp. 302–369, pp. 490–513, 2010.
[5] Shi Z., Cogdill R. P., Short S. M., Anderson C. A., Process characterization of powder blending by near-infrared spectroscopy: blend end-points and beyond, “Journal of pharmaceutical and biomedical analysis”, 47(4-5), 738-745, 2008.
[6] Oliveri, P., Malegori, C., Simonetti, R., & Casale, M. (2019). The impact of signal pre-processing on the final interpretation of analytical outcomes–A tutorial. Analytica chimica acta, 1058, 9-17.

