Pharmakeyboard_arrow_rightImpact of annealing and controlled ice nucleation on properties of a lyophilized 50mg/ml MAB formulation.
menu

In collaboration with Pfizer
We compared “ice-fog” controlled ice nucleation at -6 °C to annealing at the same temperature for a 50 mg/mL monoclonal antibody formulation, using shelf-ramp freezing as a control. Cake structure, drying time, reconstitution time, specific surface area, calculated cake resistance and size exclusion chromatography were all compared. Controlled nucleation resulted in the fastest reconstitution, shortest primary drying, lowest calculated cake resistance, lowest specific surface area and highest moisture content.
There was no effect upon the results for size exclusion chromatography.
Results for annealing were between those for controlled nucleation and shelf-ramp freezing. All results were consistent with “ice-fog” controlled nucleation at -6 °C having greater impact upon the ice crystal morphology than annealing at the same temperature for 3 h.
© 2022 The Authors. Published by Elsevier Inc. on behalf of American
Pharmacists Association. This is an open access article under the CC BY-NC-ND license (http://creativecommons.org/licenses/by-nc-nd/4.0/).
Freeze-drying; Lyophilization; Protein; Monoclonal antibody; Morphology; Nucleation; Protein formulation(s); Drying; Solid-state; Amorphism.
Lyophilization is a well-established drying process for stabilization of biologics.1-4
There are three major steps in the lyophilization process: freezing (solidification) (may or may not include an annealing step), primary drying (ice sublimation), and secondary drying
(moisture desorption).1, 5 The structure of the dry layer above the ice interface determines the cake resistance to water vapor flow during primary drying, and hence the required primary drying time.
This structure, while it can be affected during drying by temperature excursions above the collapse temperature, is initially set by the freezing and annealing steps.6 The final cake structure has a strong influence upon reconstitution time and other product quality attributes.
Annealing is frequently used after shelf-ramp freezing to reduce product resistance during primary drying, resulting in a higher primary drying rate.7-9 However, annealing also causes reduction of the product specific surface area, which can decrease the water desorption rate in secondary drying and may lead to increased residual moisture content in the final product.4, 10
There are several reports that show annealing can reduce reconstitution time when annealing results in crystallization of formulation components such as mannitol.11,12 Annealing as also been shown to affect reconstitution time for amorphous protein formulations similar to what we used.13-16 Blue et al. showed that incorporating an annealing step after freezing can reduce the reconstitution time for two separate mAbs by up to 60%.13
Controlled ice nucleation (CN) is receiving consistent attention due to its benefits in terms of improving lyophilization process performance and enhancing product quality attributes of lyophilized drug products. Several controlled ice nucleation systems have been developed and are commercially available, such as ice-fog, pressurization/ depressurization, vacuum-induced, or partial vacuum.17,18
Several papers have reported that controlled ice nucleation can also reduce the reconstitution time of high concentration protein formulations.12,16,19,20
Geidobler et al. found that CN at -5 °C led to a 66% reduction in reconstitution time of a lyophilized mAb at 161 mg/mL.19 About 50% reduction was reported by Singh et al. for
a mAb at 108 mg/mL.20
In contrast to others, Luoma et al. compared different CN techniques with 10 mg/mL and 100 mg/mL mAb formulations and found that the partial vacuum and depressurization techniques actually increased reconstitution time, and that ice-fog CN produced results similar to shelf-ramp freezing.18
There is a lack of published data comparing annealing and controlled nucleation in which both processes are carried out at the same temperature. We compared controlled ice nucleation at a shelf temperature of -6 °C with annealing at same temperature (-6 °C), evaluating cake structure, primary drying time, reconstitution time, specific surface area, and size exclusion chromatography. We saw improvements in lyophilization cycle time and in product reconstitution time with controlled nucleation and found that similar benefit obtained by using controlled nucleation could also be achieved using annealing.
The protein used in this study was a IgG2 monoclonal antibody (mAb) manufactured by Pfizer. The mAb formulation was 50 mg/mL IgG2 in 10 mM histidine buffer pH 5.5 containing 8% sucrose and 0.2 mg/mL polysorbate-20. The excipients chosen for the studies were based on those typically used in protein formulations.21
The mAb bulk formulation was filtered through a 0.22 mm membrane filter and was filled into 10 mL Type I clear glass vials with 4 mL fill volume in a general laboratory environment. The vials were partially stoppered with 20 mm Flurotec coated butyl rubber stoppers for lyophilization. Histidine was purchased from JT Baker (Center Valley, PA). Polysorbate 20
(containing low carbonyl and peroxide) was purchased from Thermo Scientific (Rockford, IL). Sucrose was obtained from Pfanstiehl Laboratories (Waukegan, IL). EDTA was from JT Baker (Center Valley, PA). Distilled, deionized water was used throughout.
All samples were freeze-dried using a SP LyoStar-3 lab scale freeze-dryer (SP Scientific, Stone Ridge, NY). One shelf was loaded with 30-50 samples surrounded by placebo vials to completely fill the shelf. Product temperature was measured using thermocouples inserted into sample vials. Tables 1 shows the freezing and drying conditions used for the three different cycles tested.
| Shelf Ramp Freezing | Annealed -6 °C | Controlled Nucleation -6 °C | |
| Sample loading | 20 °C | 5 °C | -6 °C |
| Freezing | Ramp 20 °C to 5 °C at 1 °C/min then to -45 °C at 0.5 °C/min, hold 90 min | Ramp 5 °C to -45 °C, hold 90 min | Hold -6 °C for 150 min, ice fog controlled nucleation, ramp to -45 C and hold 90 min |
| Annealing | n/a | Ramp -45 °C to -6°C, hold 180 min, ramp -6 to -45 °C, hold 90 min |
n/a |
| Drying pressure | – | 50 mTorr | – |
| Primary drying | – | Ramp − 45 °C to -25 °C, hold 90 h | – |
| Secondary drying | – | Ramp -25 °C to +35 °C at 0.2 °C/min, hold 10 h | – |
| Total cycle time (includes annealing and CN equilibration time) | 110 h | 116 h | 110 h |
The controlled nucleation and annealing temperature of -6 °C (shelf temperature) was selected to be far enough below zero to give confidence that even the edge vials on the shelf would not melt completely. For shelf ramp freezing without annealing, the shelves were at 20 °C for loading, the chamber was ramped at 1 °C/min to 5 8C and then ramped at 0.5 °C/min to -45 8C and holding for 90 minutes. The cycle named “Annealed -6 8C” samples were loaded on the shelf pre-cooled to 5 8C, held for 10 minutes, then the shelf temperature was ramped down to -45 °C at 0.5 8C/min then held for 90 minutes. For annealing the shelf was ramped up to -6 8C at 0.5 8C/min, held for 3 h, re-cooled to -45 8C at 0.5 8C/min, and held for 90 minutes to re-freeze.
The “Controlled nucleation -6 8C” cycle used a KRYOSEQ ice-fog nucleation system (IMA Life/Linde, Tonawanda, NY). For this process, the sample vials were loaded and held on the -6 8C shelf for 2.5 h, after which the chamber pressure was reduced to 2.8 psia and nitrogen gas carrying ice crystals was introduced into the chamber to induce nucleation. The shelf temperature was then ramped to -45 8C at 0.58C/min.
Primary drying conditions were set to maintain the product temperature near or below its collapse temperature while in the presence of ice, which was determined to be approximately -28 8C using freeze-drying microscopy. At the end of freeze drying, the product chamber was backfilled with nitrogen to approximately 600 Torr and the vials were stoppered before unloading. Samples were crimped to seal with flip-off seals and kept refrigerated until analysis.
Karl Fischer (Mettler Toledo, Columbus, OH) was used to determine residual water content in the lyophilized cake. The titration sample was prepared by dissolving/suspending the cake in a diluent of 50% formamide/ 50% methanol mixture. The samples were then vortexed to extract residual water before the coulometric titration for water content.
Lyophilized cake samples were mounted on Scotch tape-covered stubs using silver paste. Samples were sputter-coated with 10 mm gold using Gressington 108 instrument (Gressington Scientific Instruments, Watford, UK) prior to imaging. Gold coated sampleswere analyzed using a JOEL JCM-600-Plus scanning electron microscope (JOEL, Peabody, MA) using secondary electron detector at 5 keV and 200-300mBar.
Gemini 2380 instrument (Micromeritics, Norcross, GA) was used to measure the SSA of the freeze-dried samples. Samples were placed in the bulb glass tubes in a dry box and passively purged with dry nitrogen for at least 48 h. The instrument provides an option to use free space balancing with the glass beads and this approach makes nitrogen gas acceptable for measurement of low SSA. Sample and reference tubes were evacuated at 200 mmHg/min. SSA of each sample was measured using Nitrogen with multi-point BET analysis method.
Free space differential was measured using helium. To facilitate measurements with the low SSA tube was partially filled with glass beads to minimize differences in the free space volume. The weight of samples was used to calculate the specific surface area.
The lyophilized cakes were reconstituted by addition of 3.6 mL water for injection (WFI). Reconstitution was performed by applying gentle swirling after the addition of water. Reconstitution time was determined by visual observation of complete dissolution. The reconstitution time was determined with three cake samples and reported with an average of the three measurements.
Separation was performed with YMC-Pack Diol-200, 300 x 8 columns, neutral phosphate buffer/NaCl mobile phase, and detection at 280 nm sing Agilent HPLC system (Agilent, Santa Clara, CA). The monomeric species is identified by its characteristic retention time relative to a reference standard. Typical method precision was approximately 0.1% RSD for IgG monomer.
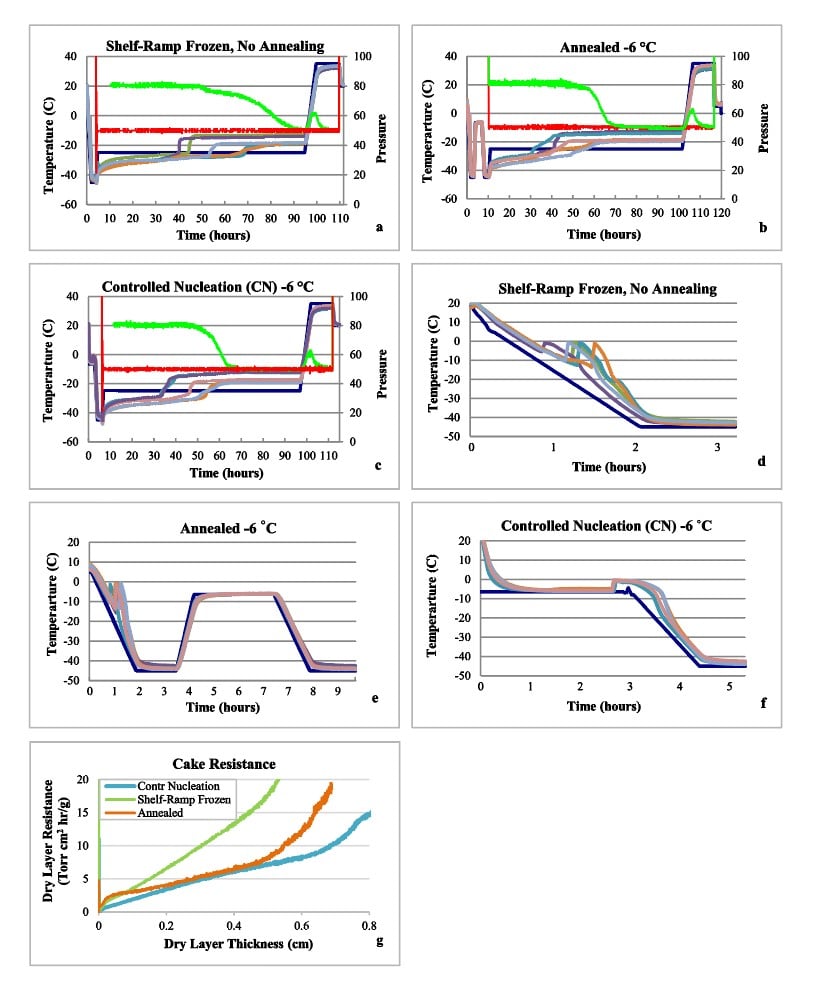
The lyophilization cycle run profiles for the three cycles are shown in Fig. 1a-c, and plots of freezing are in Fig. 1d-f. Primary drying times, shown in Table 2, were calculated as the time for the Pirani pressure sensor to equilibrate close to the pressure measured by the capacitance manometer. Primary drying time was significantly reduced (30% reduction) by CN compared to shelf-ramp freezing without annealing.
This result agrees with other reported CN studies. For example, Awotwe-Otoo et al compared conventional shelf-ramp freezing to pressurization/ depressurization CN, and primary drying time was reduced by 19%.22 A similar study reported by Konstantinidis et al achieved a 41% reduction in primary drying using CN.23 In comparison to the 30% decrease in primary drying that we observed with CN at -6 °C, we found a nearly identical reduction of 29% with simple annealing at -6 °C. Note that residence time of product between -6°C and 0°C (Fig. 1b), after nucleation was induced, was about 1 h as opposed to 3 h during annealing step.
Cake resistance to the flow of escaping water vapor is an important factor used to characterize how ice crystal size impacts product temperature and drying rate during lyophilization.22 Fig. 1g shows calculated cake resistance curves for the three cycles used in this study. The resistance of cake as a function of dry layer was calculated from the product temperature profile, using the approach used by Tchessalov et al.24
The cake resistance for the controlled nucleation and annealed cycles were much lower than the shelf-ramp frozen cycle. For parts of the cycle the annealed product had slightly higher resistance than the CN product. Our findings are similar as reported by Gieseler who found that cake resistance after controlled nucleation freezing at -3 °C was reduced by about 25% compared to shelf ramp freezing. Annealing at -15 °C for 6 h resulted in cake resistance similar to CN.25
| Sample | Primary Drying Time (hr) | Moisture (%) | Recon. Time (sec) | Surface Area Multi-point BET (m2/g) | HMMS (%) | Monomer (%) |
| Shelf-Ramp Freezing | 87 | 0.2 | 129 ± 11 | 1.4 | 1.9 | 98.1 |
| Annealed -6 °C | 62 | 0.5 | 71 ± 6 | 0.8 | 2.0 | 98.0 |
| Controlled Nucleation -6 °C | 61 | 0.9 | 49 ± 4 | 0.6 | 1.9 | 98.1 |
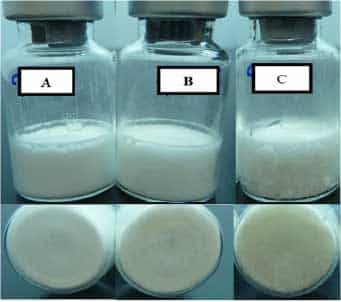
The lyophilized cakes from the three cycles each appear slightly different. As seen in Fig. 2, the CN cake appears less elegant due to larger pores and some cracks. Microscopic appearance in Fig. 3 confirms the larger pores of the CN cake, especially at the bottom of the cake. The SEM images in Fig. 3 also show that pore sizes at the bottom of the cakes are progressively larger in the order shelf ramp frozen < annealed < CN. Our findings in this regard are not unique.
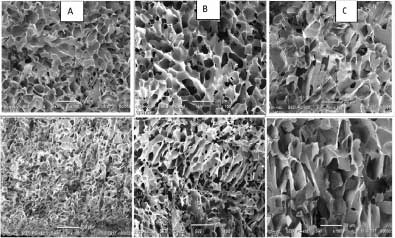
Gieseler reported the cake with CN had a more porous and fragile cracked structure.25 SSA of the samples were 1.4 m2/g for shelf-ramp frozen without annealing, 0.8 m2/g for annealed, and 0.6 m2/g for controlled nucleation. These results align with the other observations given that the SSA of the dried cake is initially established by the freezing / annealing process (as long as the lyophilization cycle is sufficiently conservative to avoid collapse). The larger SSA of the product prepared with CN method agrees with other reports.20, 22 Awotwe-Otoo et al reported that CN resulted in cake of a mAB formulation with SSA of 0.46 m2/g compared to shelf-ramp frozen SSA of 0.90 m2/g.22
As discussed above, others have found that CN could reduce reconstitution time of lyophilized products.19,22 We observed a similar result in which the reconstitution time of the CN cake was reduced to 49 seconds from 129 seconds (Table 2).
In contrast, the reconstitution time of annealed samples was 71 seconds, slightly longer than CN but still faster than the controls. This result agreed with the results reported by others.13,15,16 The shorter reconstitution times for the CN and annealed cakes were likely due to the more open network of larger pores.15
The residual moisture contents (Table 2) were in order: 0.2% for shelf-ramp frozen without annealing, 0.5% for annealed, and 0.9% for CN. Higher moisture for CN has been reported
in many publications5,19,22,26 and is consistent with the SSA differences. Higher SSA for shelf-ramp freezing product is responsible for its lower moisture content. The higher moisture level in the annealed cake observed in this study indicated that the -6 °C annealing also increased the crystal size and decreased the water desorption rate in secondary drying, which was similar to what was observed for the CN cycle.
Protein aggregates can occur during formulation, lyophilization processes and storage.27 To assess the quality of the lyophilized cake produced from shelf-ramp frozen, annealed, and CN cycles, soluble aggregates of the protein in reconstituted solutions were determined using the SEC method (Table 2). There was no significant change in high molecular weight species or % monomer for all samples regardless of lyophilization conditions. Fang et al reported that lyophilized IgG and rHSA proteins with lower SSA can reduce aggregation28 due to the reduction of adsorption of protein at the ice/freeze-concentrate interface.29 We did not see a difference in aggregation among the controlled and non-controlled nucleation methods. This could be due to the presence of polysorbate-20 in the formulation, the purpose of which is to reduce aggregation, as well as the relatively high protein concentration of 50 mg/mL.
This study compared controlled ice nucleation and traditional annealing processes, in which both were carried out at -6 °C. Primary drying time, cake reconstitution time, specific surface area, crystal and pore size, SEC and calculated dry layer cake resistance were evaluated.
The results show that while “ice-fog” CN at -6 8C was most effective at reducing primary drying time, cake resistance, specific surface area, and reconstitution time; annealing at -6 8C after shelframp freezing yielded results that were nearly as good. As expected, moisture content trended inversely with these factors, meaning that shorter primary drying would be at least partially offset by additional secondary drying time and/or higher secondary drying temperature.
The authors declare that they have no known competing financial interests or personal relationships that could have appeared to influence the work reported in this paper.
The authors thank Bakul Bhatnagar for his valuable conversations in the experiment design and tests. This research did not receive any specific grant from funding agencies in the public, commercial, or not-for-profit sectors.
![]()