menu

Pharma Website
Choose the market
blur_on
Application of NIR spectroscopy for in-depth comprehension of blending unit: a chemometric approach.
Cyclops. Blending made by IMA.
Introduction
Smart design, prime performance, enduring reliability. Cyclops is a bin tumbler designed for blending and homogenizing powders and granules for the pharmaceutical, food and chemical industries. The tumbler can be installed through-the-wall for top-level GMP configuration and space saving in the processing area. Versatility and high performance are the hallmarks of IMA Active’s bin tumblers.
Cyclops fits the innovative Trigon System, a universal bin-blocking system with a unique GMP design. This system completely blocks and blends a large series of bins without the need for any additional device. The rotation axis of the Trigon System can be inclined also on the vertical plane, in order to determine a double inclination for optimal mixing.
Cyclops is available in three models, which differ for the capacity of the standard containers: Cyclops Mini (up to 250 litres), Cyclops Midi (up to 600 litres) and Cyclops Maxi (up to 2,000 litres). In addition, Cyclops Lab is available for small batch production (up to 20 litres) and R&D applications. The laboratory tumbler ensures minimum encumbrance and easy moving inside the processing area. The Bin Lab geometry is proportional to the industrial bin for scaling-up activities. The powder container can be coupled to a NIR spectrometer for the in-line monitoring of the blending process.
Case study
Blending is the central process in the manufacturing of OSD explaining why the final blend homogeneity is one of the main goal to match the specifications on the final oral solid dosage form. According to the latest FDA Guidelines for Industry, its assessment requires to be performed by determining the blending behaviour over the time and evaluating the mixing without changing the state of the blend; this can be accomplished by a Process Monitoring approach “impact-free”, suitable for a continuous verification during the process in order to collect a huge amount of data that can be representative of the whole production batch ensuring a high level of control.
The blend may be monitored thanks to one of the most powerful Process Analytical Technology (PAT) based on the acquisition of an NIR signal (near-infrared signal from 900 – 1650 nm) over time. In more detail the variation of the variability of the signals, measured as standard deviation, was followed along time, applying the so-called Moving Block Standard Deviation (MBSD). Thanks to NIR technology implemented online, was possible to measure homogeneity in continuum during this manufacturing phase.
A study using a laboratory scale tumble blender Cyclops Lab, equipped with a 15 litres bin, was carried out to evaluate both the Critical Quality Attributes (CQAs) of Raw Materials and Critical Process Parameters (CPPs). The experimental procedure was defined thanks to a rational planning, by means of a Design of Experiments (DoE). In more detail a full factorial design was used to explore the variability inside the whole experimental domain. During the experiments, a well-defined placebo formulation containing Riboflavin powder was used to replace the original active pharmaceutical ingredient (API).
In-line NIR wireless spectrometer (MicroNIR PAT-W, Viavi Solutions, USA) was installed on the tumble blender for acquiring continuous data along the whole process. The final aim of this study was to determine on-line and in a complete non-destructive way the endpoint of the process, thanks to the application of advanced chemometric strategies.
First of all, the effect of critical factors (bin filling, rotation speed, mixing time), at three levels, and one categorical variable (particle size of cellulose), at two levels, were examined through the experimental design for a total of 58 experiments (Figure 1).
In this way it is possible to understand not only the influence of the factors on the blending process but also the interaction between the factors under study. Multivariate design of experiment allows to understand the dynamics behind this widespread process. Moreover, the spectra acquired thanks to the NIR sensors were used for performing a trend analysis based on the MBSD profile. The results of this data processing were discussed together with the statistical evaluation of the three responses selected – Riboflavin Content Uniformity (HPLC Mean Concentration and RSD%), density (bulk and tapped) and flowability index (iCarr) – showing that the physical characteristics of raw materials strongly influence the blend’s flowability.
| Bin Filling (%) | Rotation Speed (RPM) | Mixing Time | MCC grade (μm) | |
| Min level (-1) | 30 | 10 | 15 | 50 |
| Central point (0) | 52.5 | 15 | 20 | – |
| Max level (+1) | 75 | 20 | 25 | 100 |
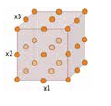
Table 1: Variables and relevant levels used in the DoE.
As expected, blends having different particle-size distribution behave differently during the mixing process (Figure 2) while the equipment set-up mainly influences the blend’s uniformity.
For all the experiments, it was possible to notice that higher rotation speeds and longer mixing times lead to have smoother MBSD profile (Figure 3); this behaviour was highlighted at the maximum bin filling for the less flowable blend – containing cellulose 50 µm – and at the medium bin filling for the more flowable blend – containing cellulose 100 µm. These outcomes were supported by the results obtained from wet chemistry in terms of Riboflavin Content Uniformity – determined by the criteria established from Authorities. In light of the study, carried out until now, a pilot scale up stage is planned, being the NIR sensor applicable to all tumbler bin scale. In this way, the possibility to obtain correlated blending profile and to provide a reliable in-process product characterisation will be tested. In conclusions, the proposed approach provides a cutting edge sensor that monitors the blending process without any perturbation of the system under study; errors associated with these measurements are also take into account.
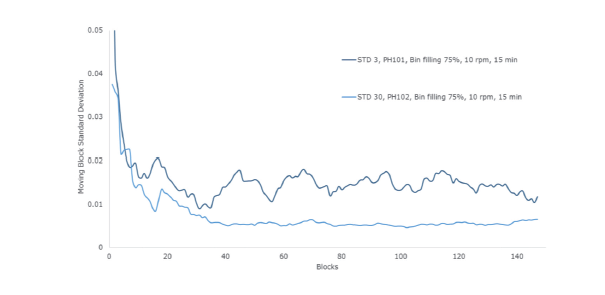
Figure 2: MBSD profile obtained on both the blends at fixed process parameters.
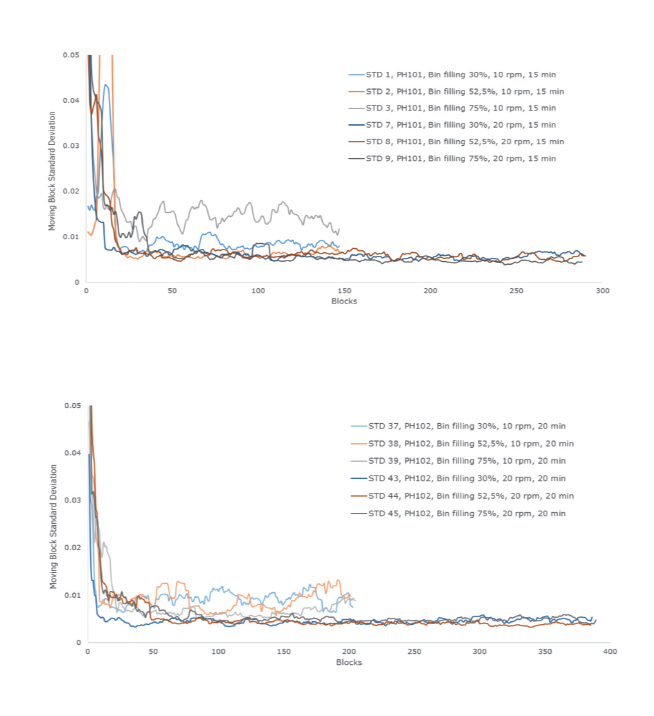
Figure 3: MBSD profile obtained on both the blends by varying the equipment set-up.

In collaboration with
