menu

Pharma Website
Choose the market
blur_on
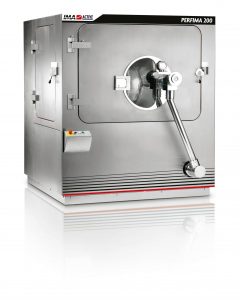
Validation of the Cleaning in Place of the coating pan PERFIMA, IMA
1. Introduction
The validation project was aimed at assuring that the Cleaning In Place procedure of the pan PERFIMA can produce, independently from the characteristic of the utilized product, a result complying to the Canadian guidelines for the washing processes (“Cleaning Validation Guidelines”, HPFB, Health Canada, 2002). Nowadays these guidelines represent the most restrictive specifications among those available in the developed Countries.
These specifics are not strictly fixed, but they can be adapted to particular cases applied during cleaning process.
1.1 Cleaning specifications
The rules used to value the degree of cleaning are those discussed in the “Cleaning Validation Guidelines”.
They are:
- Not more than 10 ppm of a product appears in a product worked afterwards.
- Visible residue should not be present. Visible residue is quantified in 100 μg of powder per 2×2 inch2 (~25 cm2), namely 4 μg cm-2. Moreover it must be demonstrated that at the end of the rinsing phase, the discharged water characteristics are identical to those of used water.
1.2 Marker choice and working plan
A marker substance is used in the validation procedure to highlight the efficiency of the cleaning process. This substance should be removed efficiently and important quantity inside the machine or in the following production batches should not be found. During the cleaning process detergent substances are used; these substances can be either acid or basic and should be efficiently removed during the rising step.
In the present validation project the pan was washed with acid detergent. An acid detergent can dissolve substances with basic characteristics and remove them easily, while it may cause the precipitation of substances with acidic characteristics. Therefore, the removal of an acid substance is the most critic situation. If the cleaning process is validated in this situation (acid substance, acid detergent) there are good possibilities that the process would be successfully applicable to many other substances.
For this reason, it has been chosen an acid marker, fluorescein, which can be also quantified at very low concentration (2×10⁻⁶ppm). The work planned applied was divided in three different tests:
TEST A. Production of a batch of tablets coated with a film forming solution containing materials partly soluble in water and sodium fluorescein as a partly water soluble marker.
The cleaning phase was carried out through cycles of pre-wash, wash with acid detergent and rinsing.
The check was based on the analysis of pre-wash, wash and rising water. Furthermore, to highlight the residues the machine parts were visually inspected and the metallic surfaces swabbed. Moreover, rising waters were analyzed to quantify phosphates and organic substances (TOC) content.
TEST B. Production of a “placebo” tablets batch, after the cleaning of the pan, using a coating mixture having a composition similar to that previously mentioned but without marker, to check for possible tracer cross contamination.
TEST C. Recovery test to check whether all added marker could be totally recovered with the cleaning procedure.
2. Experimental Part
2.1 Analytical procedures
2.1.1 Sodium fluorescein
The amount of fluorescein in buffer solution pH 8 (FU XI) was quantified by HPLC using a Perkin Elmer liquid chromatograph which included a fluorimetric detector (absorption at 450 nm, emission at 500 nm) and an analytical Novapak™ C18 column (Waters, Milford, USA). The mobile phase consisted in a mixture of methanol and tetrabutyl-amonium bromide 0.005 M water solution (47:53, v/v) at a flow rate of 1 mL/min. In these conditions, the limit of quantification resulted as lower as 0.002 ng/mL. The calibration curve obtained (Figure 1) showed a good relationship between signal (area under the peak, AUC) and fluorescein concentration.
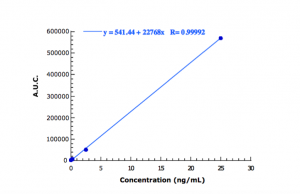
Figure 1: HPLC calibration curve of sodium fluorescein in buffer solution pH8
2.1.2 Phosphates
The phosphates determination was carried out using the “Phosphates Limit Essay” (Ph Eur IV 2002).
100 mL of the solution were added with 4 ml of sulphomolybdic reagent, shaken and added with 0.1 mL of stannous chloride solution.
The standard was prepared in the same manner using 2 mL of phosphate standard solution (5 ppm PO₄) and 98 ml of water. The colour of 20 mL of each solution was compared after 10 minutes.
The colour of any test solution should not be more intense than that of the standard. Sulphomolybdic reagent was prepared as follow: dissolve with heating 2.5 g of ammonium molybdate in 20 mL of water. Dilute 28 mL of sulphuric acid in 50 ml of water, then cool. Mix the two solutions and dilute to 100 mL with water. Stannous chloride solution was prepared as follow: immediately before use, dilute 1 volume of stannous chloride solution with 10 volumes of diluted hydrochloric acid.
Stannous chloride solution was prepared as follow: heat 20 g of tin with 85 mL of hydrochloric acid until no more hydrogen is released. Allow to cool.
Store the solution over an excess of tin, protected from air. Phosphate standard solution (5 ppm PO₄) was prepared as follow: a quantity of monobasic phosphates potassium corresponding to 0,716 g of KH₂PO₄ is dissolved in water and made up to a volume of 1000 mL. 1 volume of this solution is diluted to 100 with water immediately before using.
Besides the visual comparison with the reference standard, as described in European Pharmacopoeia, the phosphates concentration was quantified spectrofotometrically at 340 nm.
2.1.3 pH
The determination of pH value was done at second decimal digit with potentiometric method.
2.1.4 Total Organic Carbon (TOC)
The determination of the total contents in organic carbon was performed according to USP 28.
3. Test A
3.1 Test conditions
3.1.1 Machine set-up
The pan was loaded with a small tablet batch (50 kg) to mimic a worst case scenario (more losses). The film coating was sprayed by means of 3 Schlick ABC guns (nozzle diameter 1.2 mm) installed on a PCA arm.
The coating solution had the following composition:
| Opadry II white | kg 1.5 |
| Sodium fluorescein | kg 0.1 |
| Sodium bicarbonate | kg 0.0425 |
| Water | kg 8.5 |
| Total | kg 10.1425 |
First of all the spray line was filled with the coating solution, then a preheating phase was performed. The coating time was approximately 1 hour to achieve a 3% weight gain using the standard coating solution.
The pan was unloaded in a semiautomatic way at the end of the coating step. The spray line was cleaned by spraying hot water inside the empty pan (approx. 5-8 L) and then the guns were positioned inside the pan for the CIP.
The reservoir connected to the peristaltic pump was dismantled and cleaned manually.
3.1.2 Tablets production
The tablets used for the coating process had the following composition:
| Lactose spray dried | 60% |
| Avicel PH 102 | 39% |
| Magnesium stearate | 1% |
3.1.3 Description of the cleaning procedure
As a detergent for the washing phase ANTOS PH (DK Ausiliari Chimici, Ozzano Emilia, Italy) was used. This detergent contains phosphoric acid, which offers the opportunity to check the efficacy of the rinsing through the analysis of phosphates with the “Phosphates limit essay” according to Ph Eur IV 2002. The washing cycle developed through the following phases:
- pre-washing
The pre-washing phase aimed to remove from the machine surfaces most of the residual material. In this phase 435 L of hot (50 °C) tap water, at the pressure of 4 bar and with a flow of 40 L/min were used. - washing with detergent
435 L of detergent solution at 1% w/v in hot tap water, at the pressure of 4 bar and with a ow of 40 L/min were employed for removing all soluble and insoluble materials. - rinsing
This phase was divided into 2 steps and had the aim to remove completely the detergent. 435 L of demineralized water pumped at a pressure of 4 bar for each cycle were used, for a total of 870 L. - drying
During this final phase the pan, rotating at 18 rpm, was dried with hot air (temperature 80 °C, absolute humidity 5.8 g/kg), for 30 minutes with a flow of 3000 m³/h.
3.2 Samples recovery and preparation
To assess the efficacy of the washing procedure, the following samples were taken:
a) Solution samples
| Samples | Code |
| Phase 1: prewashing discharging step, start | P1A |
| Phase 1: prewashing discharging step, end | P1B |
| Phase 2: washing discharging step, start | P2A |
| Phase 2: washing discharging step, end | P2B |
| Phase 3: rinsing discharging step, start | P3A |
| Phase 3: rinsing discharging step, end | P3B |
| Phase 4: rinsing discharging step, start | P4A |
| Phase 4: rinsing discharging step, about end | P4B |
| Phase 4: rinsing discharging step, end | P4C |
The pH value was measured for each sample. In order to determine the fluorescein content, all samples were diluted with an appropriate volume of buffer solution pH 8 (FU XI) to dissolve completely the marker.
The rinsing samples were analyzed also to determine phosphates content and total organic carbon (TOC).
b) Metallic surfaces swab sampling
Swab sampling was carried out using a hydrophilic cotton swab of 24 cm² impregnated with 1 mL of a NaHCO₃ 0.5% (w/v) solution. Table I lists the parts of the machine sampled along with the relevant surface.
| Sampled surfaces | Area (cm2) |
| Right door sealed surface | 1645.72 |
| Right door inflatable seal | 1746.55 |
| Left door inflatable seal | 1408.84 |
| Left door sealed surface | 1645.72 |
| Partial surface left door (10×10 cm) | 100.00 |
| Partial surface right door (10×10 cm) | 100.00 |
| Right front spray ball pipe | 471.24 |
| Complete schlick PCA arm | 5016.73 |
| Spray solution inlet pipes | 502.65 |
| Window’s glass | 1621.20 |
| Front rotating cleaning head | 575.85 |
| Round door’s sealed surface | 350.98 |
| Spray ball pipe and seal (inside exhaust plenum) | 94.81 |
| Exhaust plenum inside surface | 6375.07 |
| Welded clamp exhaust plenum (inside surface) | 70.00 |
| Seal between exhaust plenum and exhaust duct | 430.02 |
| Exhaust duct inside surface | 12156.69 |
| Sink bottom | 21757.96 |
| Round door’s inflatable seal | 299.58 |
| Drum opening turning | 338.27 |
| Spray balls and pipe under exhaust plenum | 675.83 |
| Inside perforated drum between welds + mixing baffle surface | 3897.69 |
| Outside perforated drum between welds + mixing baffle base | 3453.73 |
| Back drum plate and rotating cleaning head | 4461.38 |
| Inside back cone | 12600.19 |
| Inside front cone | 14615.06 |
| Partial outside back cone (20×20 cm) | 400.00 |
| Partial outside front cone (20×20 cm) | 400.00 |
| Inside front door | 12672.09 |
| Partial right back side (20×20 cm) | 400.00 |
| Partial left back side (20×20 cm) | 132.00 |
| Inside air out duct + pipe + spray ball + seal | 189.25 |
| Air out duct + pipe + spray ball + temperature probe | 2628.91 |
| Pipe position “IV” | 365.07 |
| Inside sink drain | 1.47 |
| Right back pipe and spray balls | 658.79 |
| Air in duct + pipe + spray ball | 2474.47 |
Table I: pan sampled area
Swabs were extracted with 20 mL of a buffer solution pH 8. The obtained solutions were filtered (0.45 μm) and analyzed by HPLC.
The process of extraction of fluorescein from swabs was previously validated (mean recovery: 98.9%).
3.3 Results
3.3.1 Visual check
The visual check with ambient and UV light (253 nm) did not evidence visible residues.
3.3.2 Analytical results
Analytical results are reported in Figures 2, 3, 4 and in Tables II, III, IV.
Analysis of the discharged water
The fluorescein concentration in the pre-washing, washing and rinsing water is presented in Figure 2.
It can be observed that the fluorescein concentration dropped well below 1 ppm at the end of the pre-washing phase.
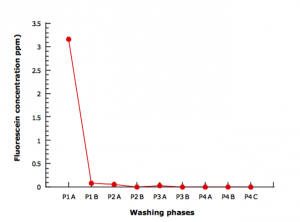
Figure 2: fluorescein concentration in pre-washing, washing and rinsing water
In the rising phase (Figure 3), a general trend toward a progressive diminution of the fluorescein concentration in each phase can be evidenced. At the end of this phase the tracer concentration leveled around 0.0005 ppm.

Figure 3: fluorescein concentration in rising water
pH, Phosphates and Total Organic Carbon (TOC) concentration
To further evaluate the characteristics of the water discharged during and at the end of washing operation, the pH value, phosphates concentration (indicating the residual detergent) and total organic carbon (TOC) were evaluated. As illustrated in Figure 4, the pH of the discharged water, went down during the washing procedures because of the presence of acid detergent, thus turned to be very close to neutral value (7) in the samples relevant to the rinsing phases.
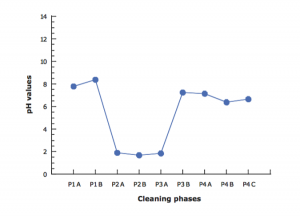
Figure 4: pH variations during pre-washing, washing and rinsing steps
Phosphates concentration is presented in Table II. The values obtained for all samples were above Ph Eur IV limits (0.1 ppm), except for the last one.
It is possible, however, to note a progressive reduction of phosphate concentration. A value lower than Ph Eur IV limit was attained with the sample PC4, indicating that the rinsing procedure was able to eliminate completely detergent residues.
| Samples | Absorbance (340 nm) | Phospate concentration (ppm) |
| Reference Ph Eur IV | 0.2746 | 0.1 |
| P3A | n.d. | > 0.1 |
| P3B | 0.7905 | > 0.1 |
| P4A | 0.6301 | > 0.1 |
| P4B | 0.3828 | > 0.1 |
| P4C | 0.2697 | < 0.1 |
Table II: phosphate concentration in rinsing water.
Table III shows the carbon concentration in rinsing, tap and demineralized waters. All values of TOC are higher then the value of TOC reported on FUI XI for depurated water (0.5 ppm/500 ppb), although a trend toward a progressive reduction of TOC value can be clearly evidenced for the rinsing water samples.
The final rising sample attains a TOC value not significantly different from those of tap and demineralized water used in the CIP process.
| Samples TOC | TOC (ppm) |
| P3A | 62.1 |
| P3B | 7.11 |
| P4A | 6.11 |
| P4B | 4.93 |
| P4C | 3.22 |
| H2O demi | 2.48 |
| Tap H2O | 3.65 |
Table III: carbon concentration in rinsing waters
Swabbing of the metallic surfaces
Table IV reports the amount of fluorescein found in different parts of the machine per unit of sampled surface. It can be observed that in all cases, the amount recovered was very low and well below the specific limit required from the adopted guideline
Round door’s inflatable seal2.4 x 10-3
| Sampled surfaces | μg of fluorescein/cm2 |
| Right door sealed surface | 9.4 x 10⁻⁵ |
| Right door inflatable seal | 3.7 x 10⁻⁵ |
| Left door inflatable seal | 1.7 x 10⁻⁵ |
| Left door sealed surface | 2.1 x 10⁻⁵ |
| Partial surface left door (10×10 cm) | 8.9 x 10⁻⁵ |
| Partial surface right door (10×10 cm) | 1.6 x 10⁻⁴ |
| Right front spray ball pipe | 4.4 x 10⁻⁵ |
| Complete schlick PCA arm | 3.5 x 10⁻⁵ |
| Spray solution inlet pipes | 4.3 x 10⁻⁵ |
| Window’s glass | 7.8 x 10⁻⁶ |
| Front rotating cleaning head | 4.3 x 10⁻⁵ |
| Round door’s sealed surface | 3.6 x 10⁻³ |
| Spray ball pipe and seal (inside exhaust plenum) | 6.4 x 10⁻³ |
| Exhaust plenum inside surface | 5.3 x 10⁻⁵ |
| Welded clamp exhaust plenum (inside surface) | 1.9 x 10⁻⁴ |
| Seal between exhaust plenum and exhaust duct | 2.0 x 10⁻³ |
| Exhaust duct inside surface | 5.3 x 10⁻⁵ |
| Sink bottom | 1.9 x 10⁻⁴ |
| Drum opening turning | 3.5 x 10⁻⁵ |
| Spray balls and pipe under exhaust plenum | 3.8 x 10⁻⁵ |
| Inside perforated drum between welds + mixing baffle surface | 8.9 x 10⁻⁶ |
| Outside perforated drum between welds + mixing baffle base | 1.0 x 10⁻⁵ |
| Back drum plate and rotating cleaning head | 5.9 x 10⁻⁷ |
| Inside back cone | 9.1 x 10⁻⁶ |
| Inside front cone | 6.4 x 10⁻⁶ |
| Partial outside back cone (20×20 cm) | 6.6 x 10⁻⁶ |
| Partial outside front cone (20×20 cm) | 3.3 x 10⁻⁵ |
| Inside front door | 2.3 x 10⁻⁶ |
| Partial right back side (20×20 cm) | 1.0 x 10⁻⁴ |
| Partial left back side (20×20 cm) | 5.6 x 10⁻⁴ |
| Inside air out duct + pipe + spray ball + seal | 4.2 x 10⁻⁴ |
| Air out duct + pipe + spray ball + temperature probe | 7.2 x 10⁻⁴ |
| Pipe position “IV” | 7.0 x 10⁻⁵ |
| Inside sink drain | 2.0 x 10⁻¹ |
| Right back pipe and spray balls | 2.9 x 10⁻⁵ |
| Air in duct + pipe + spray ball | 6.0 x 10⁻⁶ |
Table IV: quantity of fluorescein per sampled unit surface
4. Test B
4.1 Test conditions
Machine set-up and conditions used during the production phase were the same adopted in TEST A (paragraph 3.1.1 and 3.2.2) with the only difference that fluorescein was not added in the filmforming mixture.
4.2 Samples preparation
A sample of 10 tablets was taken from the pan.
The tablets were weighed and grinded.
Then 3 powder samples, each one corresponding to the mean weight of one tablet, were accurately weighed. Each powder sample was dissolved in 20 mL of a buffer solution pH 8 (FU XI), left under magnetic stirring for 60 minutes, then filtered three times.
The obtained solutions were analyzed by HPLC for fluorescein quantification.
4.3 Results
The concentration of fluorescein found in the placebo tablets was around 0.02 ppm (5.72×10⁻³ μg per tablets). This value is 500 times lower than that established by specific n°2 (paragraph 1.1) as maximum acceptable limit (10 ppm).
5. Test C
5.1 Test conditions
5.1.1 Pan preparation for recovery test
A powder mixture containing 50 g of HPMC E 5,50 g of PEG 6000 and 250 g of fluorescein was dispersed in ethanol and distributed inside the pan, to simulate the material accumulation during a normal production. Then, a complete cleaning cycle was performed as described for the TEST A (paragraph 3.1.4).
5.2 Samples preparation
The water coming from each cleaning phases (pre-washing, washing and rinsing) was collected in eleven tanks and alkalinized to pH 8 with NaOH pellets in order to assure complete fluorescein dissolution.
Samples, opportunely diluted, were analyzed by HPLC for fluorescein quantification.
5.3 Results
The total amount of fluorescein recovered from pre-washing, washing and rinsing waters was 256 g, which represents 102.4% of the theoretical quantity put inside the pan.
6. Conclusions
In general, it must be underscored that the cleaning of a coating pan represents a difficult task, as many issues should be taken into account in order to obtain a satisfactory result. In particular, the main problem that should be addressed is related to the difficulty of removing from the pan surface nebulized, composite, cohesive material, often containing water insoluble components. In the present cleaning validation trial we selected a tracer practically insoluble in acidic solutions and we used an acidic detergent in order to test the worst-case scenario. The results obtained indicate that the selected tracer can be almost completely eliminated after the first step of the cleaning procedure and that, at the end of the washing procedure no residual left inside the pan. The water discharged at the end of the CIP procedure had characteristics comparable to those of the supplied water in terms of pH and phosphate content and TOC values.
The results of the placebo trial indicate lack of cross contamination between subsequent productions. The recovery trial clearly showed the complete elimination of the tracer from the pan.
Therefore, it can be concluded that the CIP system of the Perfima pan should be considered effective and reliable.