Pharmakeyboard_arrow_rightIsoTech Lab - In-House Isolator Research & Development Laboratory - Part 2
menu

The decontamination cycle with vaporised hydrogen peroxide (VPHP) in isolated filling lines: aspects of development, validation and criticality - Part 2
The increasingly widespread use of isolators in the aseptic process meets the need to maintain product sterility levels by reducing the risk of microbiological contamination. In Part 1 we described the typical phases of the decontamination cycle with vaporised hydrogen peroxide. In present Part 2 we discuss the importance of running studies to ascertain the compatibility of the vapour phase hydrogen peroxide on the materials in isolated filling line machines, on process materials and component materials necessary for production, as well as the validation phases of a cycle with vapour phase hydrogen peroxide.
Before beginning to develop the decontamination cycle, it is necessary to define the ‘LOAD’, i.e. the materials that will be present inside the isolator during the decontamination cycle, in terms of:
Quantity – the decontamination process is a surface process, so the more numerous the load, the more surfaces will need decontaminating.
Type of material – the materials may behave differently: absorption, spontaneous release (outgassing), catalysis.
There are the various types of materials found inside an isolator:
– Materials that are part of the machines inside the isolator (liquid or powder filling machines, capping and loading/unloading systems).
The compatibility of all materials that are part of the machines inside the isolator is guaranteed by the supplier via an assessment. The assessment for material compatibility with VPHP must consider the chemical compatibility with liquid hydrogen peroxide, an assessment of the absorption and release of VPHP and an assessment of the impact of the materials on the effectiveness of the cycle.
– Process materials (e.g. bags with active ingredient, NEST).
If the production process requires the containment of an active ingredient or excipients in bags or if vials pre-sterilised inside the NEST are used and specific studies do not already exist, it is advisable to run tests on these materials in conditions closest to those of production decontamination cycles, considering a worst case approach to exposure times (e.g. a cycle repeated due to failure). In particular, check the absorption and release of material, run a cycle with biological and chemical indicators to check for any catalysis of materials. Figures 4 and 5 show two examples of tests run at the same time as the design of the isolated line.
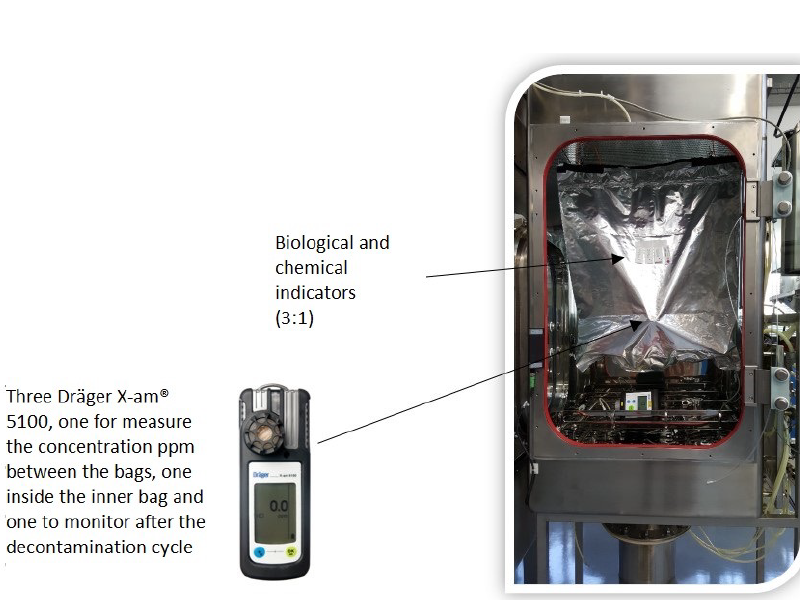
Figure 4 – Example of process materials: bags with active ingredient. Test with double bag with active ingredient in powder line to be decontaminated inside a material transfer isolator (MTI). The test aim was to ascertain that VPHP does not permeate into the bag with the active ingredient.
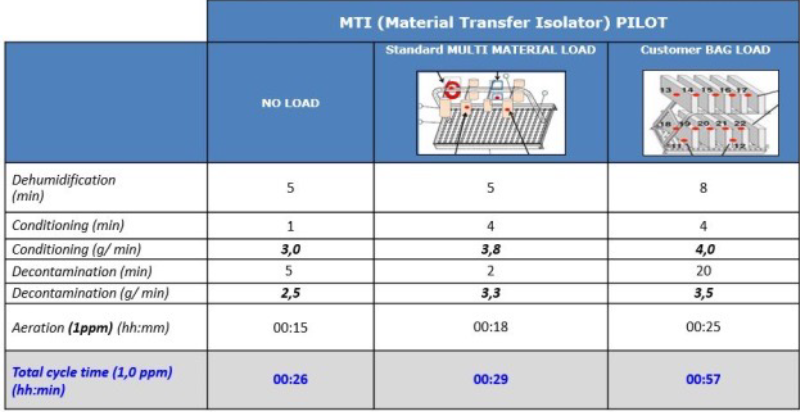
Figure 5 – Example of cycles with different process materials in an MTI. Comparing the NEST load with data obtained from tests with no load or with a standard load (bags with Petri dishes of different sizes), pincers and film, the decontamination and aeration times are considerably increased due to the material.
Bags with Petri dishes, tools such as spanners and screwdrivers, marker pens, bags with cleaning or sanitising cloths, bags with adhesive tape, filling systems, size parts. The machine supplier and the customer will work together to draw up a list of the necessary tools. Figure 6 shows a practical example.
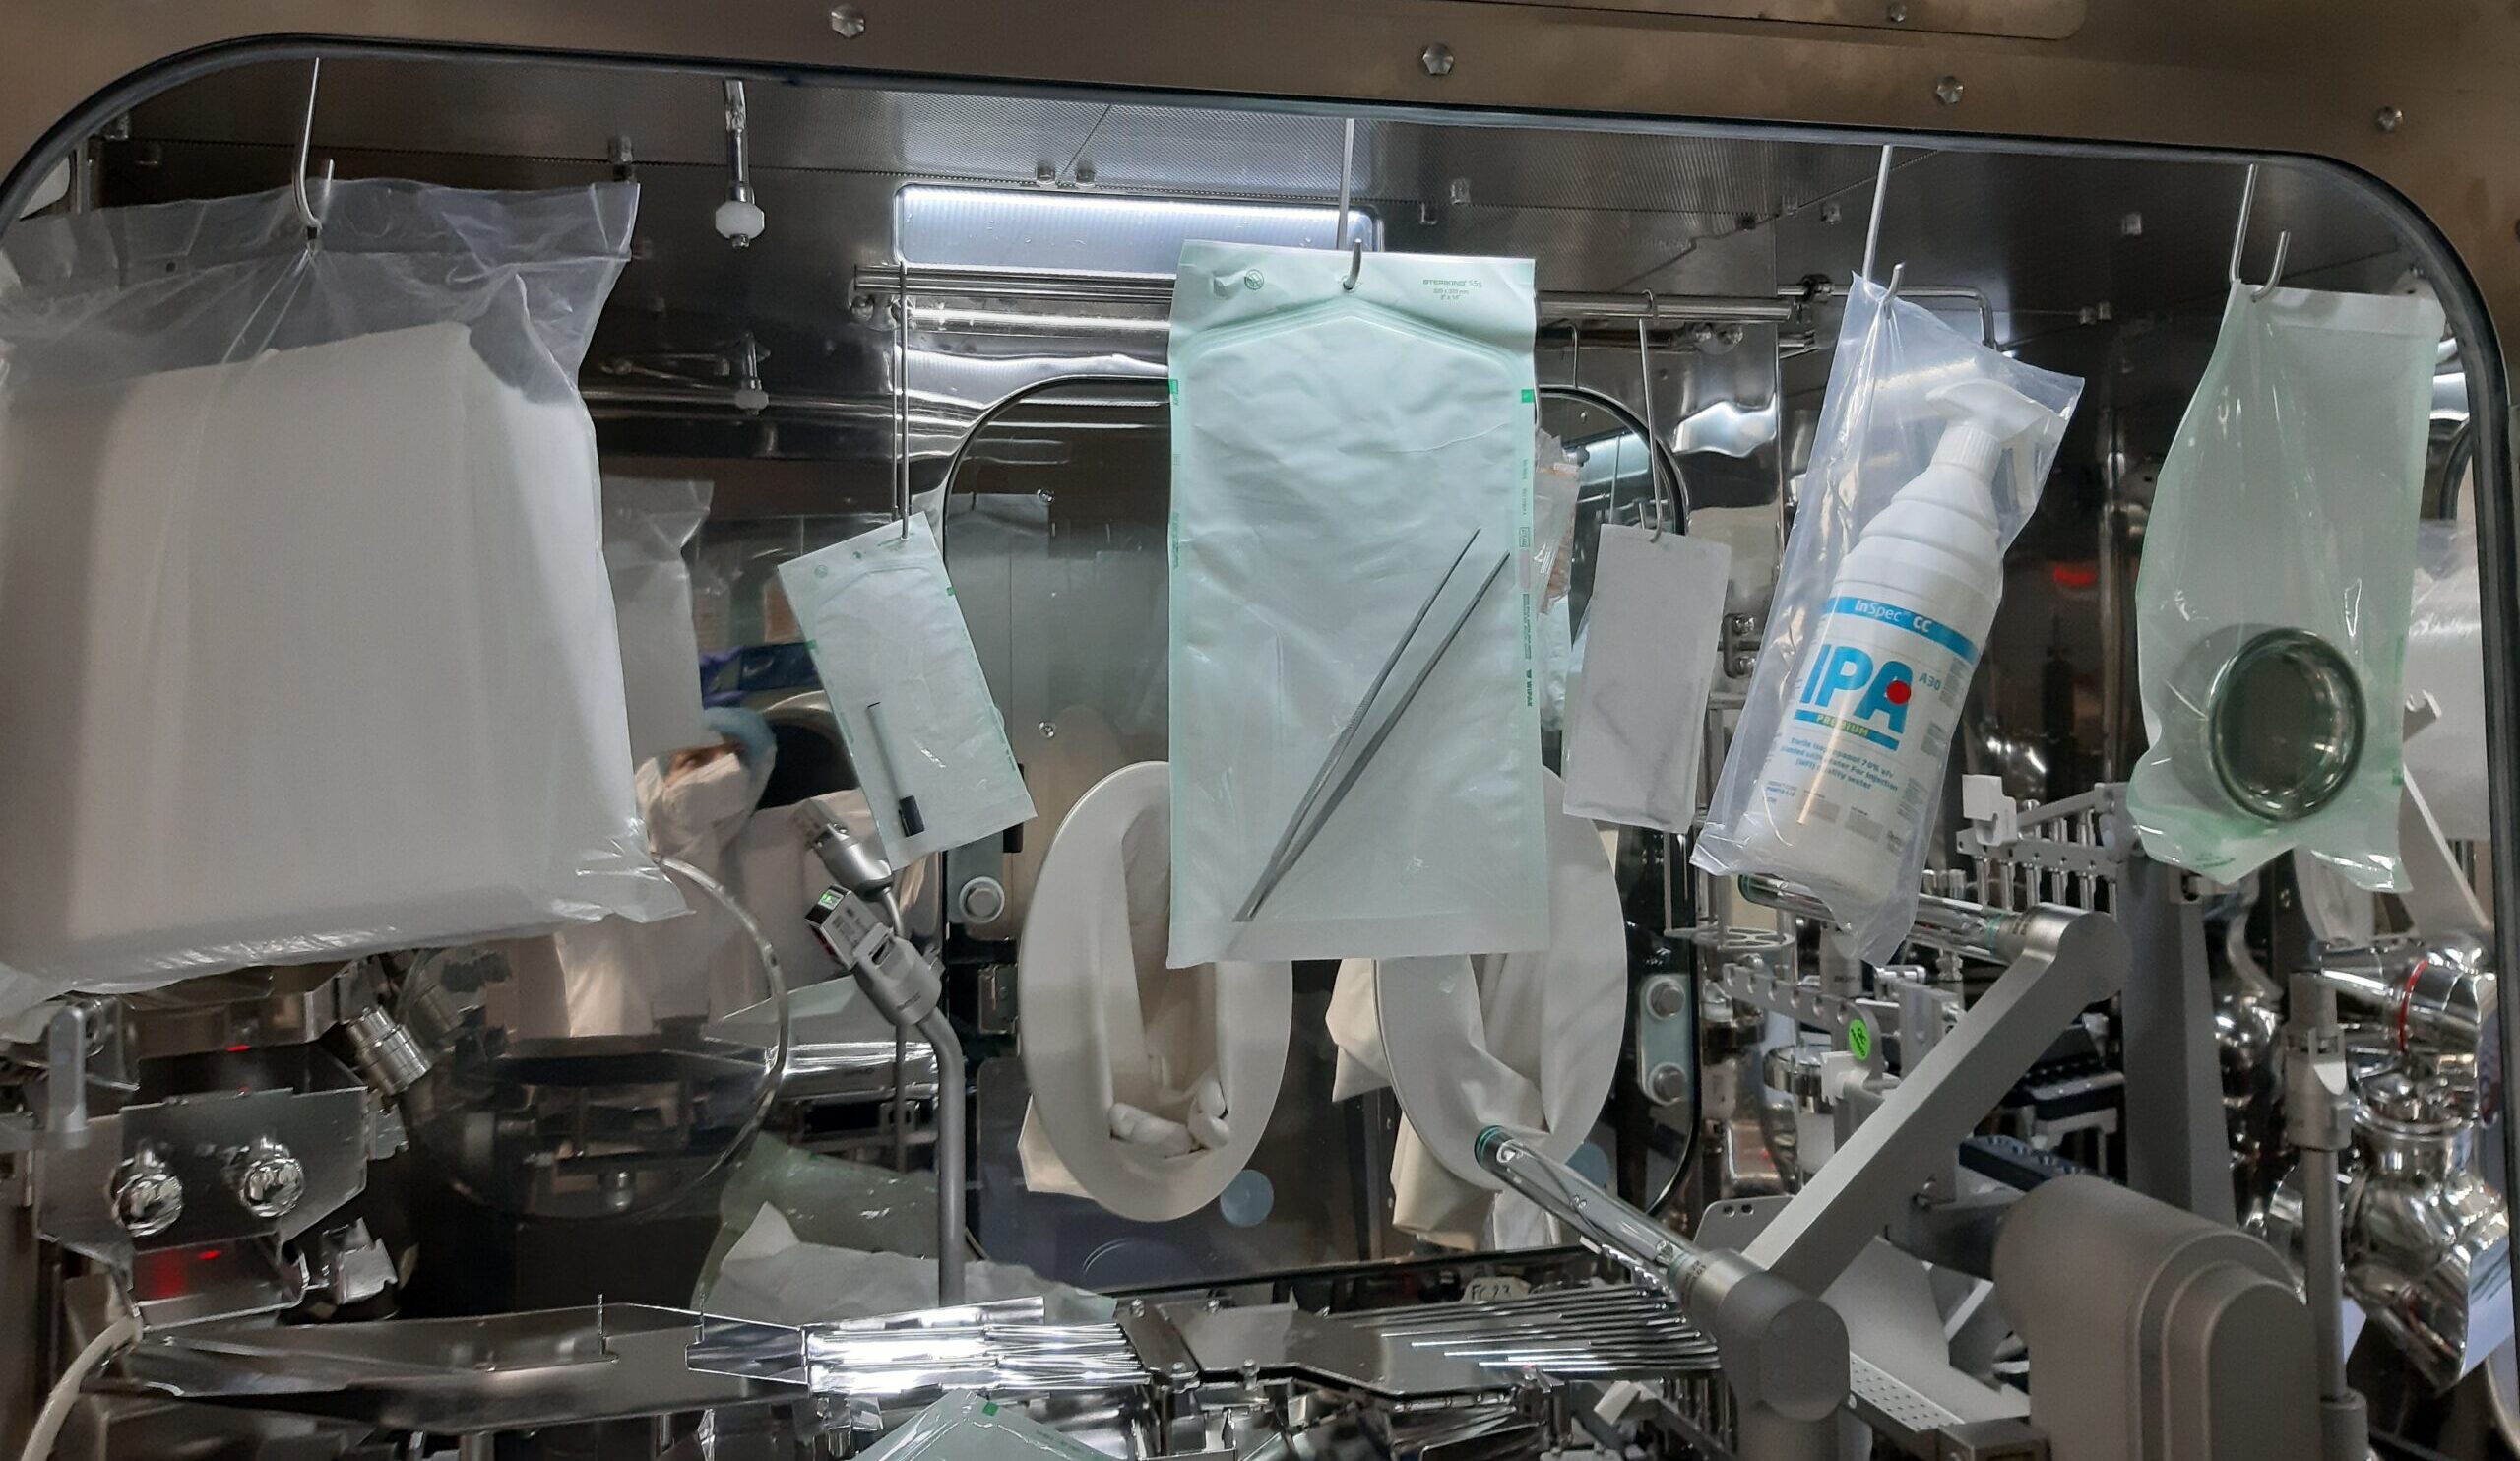
Figure 6 – Example of material inside an isolated line
Once the validation of isolator machine and dedicated equipment (i.e. VPHP generator) are complete, the definition of parameters (engineering phase) and the subsequent validation of the VPHP decontamination cycle can begin.
The aim of the definition of parameters is to arrive at a VPHP cycle with defined temperature and humidity settings for the start of injection, the quantity of H2O2 to be injected and the duration of the conditioning phase and the quantity of H2O2 to be injected during the decontamination phase.
All these parameters will be tested in the subsequent phase called Cycle Validation.
Before beginning to validate the decontamination cycle, it is important to simulate production line operation with actual engineering runs, simulating all routine (sampling, microbiological activities, operator interventions) and non-routine activities (tools and parts to be removed for size changeovers, special maintenance, damage to machine parts, removal of vials/stoppers/caps, etc.), taking into consideration all the materials that must be present or introduced during production and/or during the media-fill validation of the production campaign (often the load worst case). This activity is used to check the correct load, normally envisaged in the mock-up phase and becomes effective if carried out after training and acceptance of the machine through close collaboration with the customer.
The validation can be divided into two phases:
The first activity carried out and documented during the Cycle Development is the definition of the load, which is made up of machine parts and tools suggested by the machine manufacturer, Petri dishes used for microbiological sampling, cleaning/sanitising consumables decided with the customer and based on production requirements.
The surfaces of the isolator and relative components are then mapped to define the thermal profile and identify points with high variability.
Since VHP is a surface decontamination agent, all surfaces need to be uniformly reached by the VHP. The use of chemical indicators allows the distribution of H2O2 vapour in final isolator configuration to be mapped.
Normally, several assessments will precede execution of the tests:
Contextually, based on a visual inspection of the isolator with the maximum load, an assessment will be executed, identifying critical points related to:
The chemical and biological indicators must be distributed as uniformly as possible throughout the internal surface of the isolator.
As for the number of biological indicators per position, take into account the presence of possible rogues in commercially supplied batches, i.e. biological indicators affected by production issues and as such indicating growth even after very long decontamination times. Since the presence and exact number of rogues is unforeseeable (it may change from batch to batch), we felt a more robust option was the statistical approach using the Halvorson-Ziegler equation to calculate the MPN (most probable number) and the SLR (spore log reduction) to guarantee a reduction of at least 6 Log at all points and in all cycles.
Following this approach, three biological indicators are positioned at each critical point, while chemical indicators are placed adjacent to the biological ones in a ratio of 1:3 (one chemical and three biological indicators). A maximum acceptable number of positives is define for each cycle and for the various repetitions, to be sure that they are actually rogues. This approach is used in both of the phases indicated below and can be seen as more robust than an approach with a single biological indicator with analysis of deviation due to rogues, because it avoids having to add further variables to the verification process and scientifically manages the phenomenon from the acceptance criteria.
Figure 7 shows an example of the results following the Cycle Development.
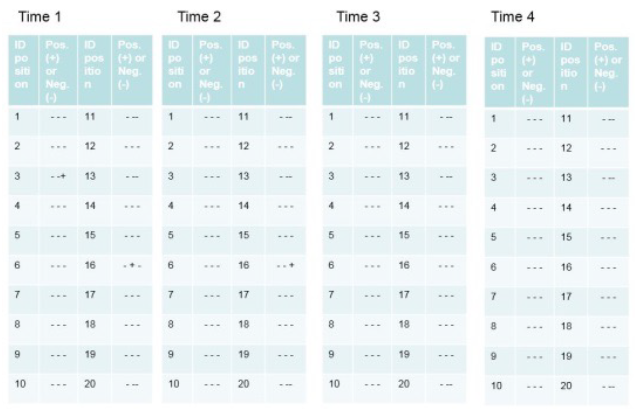
Figure 7 – Example of results of a Cycle Development. In this example, there are four decontamination times increasing from Time 1 to Time 4. The results of the biological indicators (positive and negative) are expressed based on the position of the biological and chemical indicators.
A cycle that is conforming at the end of the Cycle Development is chosen for the second validation phase, called Performance Qualification. The purpose of the latter is to confirm, through repetition of three tests, that the parameters of the decontamination cycle in the Cycle Development are reproducible and consistent.
The 6-Log reduction through the use of biological indicators and the significant change in colour of the chemical indicators in the same positions as the Cycle Development must be demonstrated. Each of the three Performance Qualification tests also demonstrates the uniform reduction of the concentration of hydrogen peroxide (from 1 ppm as a limit for operator safety to 50-100 ppb for products sensitive to oxidation due to residual VPHP or VPHP released from materials) in the entire isolator at the end of the aeration phase, through a mapping carried out with portable hydrogen peroxide concentration detectors.
If the three cycles meet the requirements, the parameters are validated and the decontamination time is increased by a safety factor, which will be the final time used by the customer in production.
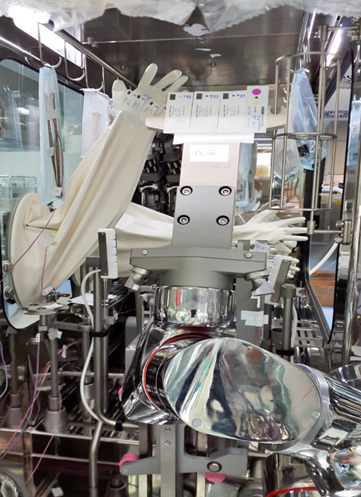
Figure 8: Internal view of a filling isolator

The exclusive tech videos shot during Achema 2024 are now available on our dedicated website