menu

Pharma Website
Choose the market
blur_on
Drug layering: the impact of up-scaling
1. Introduction
Incorporating an active ingredient in a coating formulation necessitates that both the process and equipment ensure uniform distribution of the coating material.
The majority of papers refer to the optimization of drug layering on cores in pan on small or pilot scales [1, 2]. However, it is crucial for the pharmaceutical industry to be sure that the coating uniformity is maintained and guaranteed also on production scale.
2. Purpose
The first part of the work was aimed at identifying critical coating parameters leading to drug layering uniformity on a pilot perforated pan with different loads (small, medium and large).
Then we evaluated the impact of process up-scaling on the uniformity of coating distribution using production equipment featuring the same design and maintaining geometric similarity.
3. Experimental Part
Materials
Oblong placebo tablets (Lactose Spray dried 60%, Avicel PH102 39% and Magnesium Stearate 1%) providing a density of 0.8 kg/L and mean weight of 850 mg were used as substrate for drug layering. Tablets were coated using a water based coating formula (Table 1) containing Riboflavine as a drug tracer (Polichimica, Bologna, Italy) and Methocel E5 (Colorcon, Dartford, UK) and PEG 6000 (Polichimica) as a polymer and plasticizer respectively.
| Ingredient | % |
| Riboflavine | 0.13 |
| PEG 6000 | 0.29 |
| Methocel E5 | 9.36 |
| Demi Water | 90.22 |
| Total | 100.00 |
Table 1: coating formula
| Batch | Load | Batch size (kg) |
| PILOT M | Medium | 12 |
| PILOT L | Large | 25 |
| PILOT M | Medium | 125 |
| PILOT L | Large | 160 |
Table 2: batches performed
4. Methods
Tablet coating
Tablets were coated in both pilot and production scale perforated pans; the two machines (Perfima Lab 30 liters drum, Perfima 200 liters drum, IMA) were designed maintaining the same geometric similarity, in particular pan geometry, mixing baffles design an spray apparatus [3]. Two different types of pan load (medium and maximum) were considered on both scales (Table 2). The target weight gain was 10% by weight. To assess the uniformity of coating distribution, three indicators have been evaluated:
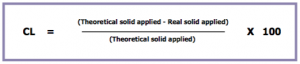
1. Coating Relative Standard Deviation (CRSD) and coating losses:
Values lower than 6% indicate a good uniformity of coating distribution. Coating Losses were calculated as follows:
2. Riboflavine Content Uniformity (CU)
The Content Uniformity (CU) has been determined according to Eur. Pharm. 7 Ed as follows: the analysis of Riboflavine content was carried out on 10 coated tablets of each batch by HPLC method, using a SYNERGY MAX-RP C12 4 μ, 80 Å, 4.6 x 150 mm column and a mobile phase consisting of a buffer solution of KH₂PO₄ and Methanol (80:20).
The Riboflavine was eluted with a flow rate of 1.2 ml/min and detected using an UV-VIS detector at 266 nm.
3. Coating morphology
The coating thickness was evaluated by Scanning Electron Microscopy (SEM ESEM- FEI Quanta 200) after cross-section of the tablets.
5. Results and Discussion
Preliminary part
Several batches were performed on pilot equipment to identify the critical process parameters (pan load, process time, gun distance, pan speed, atomization pressure, number of guns) affecting the uniformity of coating distribution, coating quality and coating losses [4]. The results demonstrated that using the minimum pan load (6 kg) the coating losses could not kept below 15% while using the medium and maximum ones the coating losses were always below 11.5%.
To ensure coating losses below 11.5% and uniformity of coating distribution below 6% the process time had to be in the range of 8-10 hours. To obtain acceptable coating losses, in the case of drug layering, the gun distance had to be less than 20 cm.
In-depth investigations
In-depth investigations of the remaining process parameters were performed: the results showed that 2 guns were necessary for both medium and maximum loads due to constant length of the cores bed. Moreover, the experiments demonstrated that, using atomization pressure of less than 2 bar and a pan speed of higher than 6 rpm, a good quality of coating was obtained.
The data showed that the optimal combination of parameters for both pilot loads (Table 3) resulted in a good coating distribution as demonstrated by the indicators of coating uniformity detailed in Table 4. The scale up of both pan loads was then performed; two batches of 125 kg and 160 kg were coated keeping the atomization pressure, gun distance, core temperature and total process time equal to the pilot scale and modifying the inlet air temperature, inlet air quantity, pan speed and number of guns (Table 3).
| Coating parameter | Pilot M | Pilot L | Prod M | Prod L |
| Process time (h) | 10 | 10 | 10 | 10 |
| Spray time (ml/min) | 22 | 45 | 220 | 290 |
| Number of guns | 2 | 2 | 4 | 4 |
| Gun distance | 16 | 16 | 16 | 16 |
| Pan speed (rpm) | 10 | 10 | 8 | 8 |
| Atomization pressure (bar) | 1 | 1 | 1 | 1 |
| Inlet air temperature (°C) | 60 | 60 | 65 | 65 |
| Tablets temperature (°C) | 39 | 39 | 39 | 39 |
| Inlet air quantity | 400 | 700 | 3000 | 3500 |
| Negative pressure | -20 | -20 | -20 | -20 |
Table 3: optimized coating parameters combination
Uniformity of coating distribution
In Table 4 the indicators of uniformity of coating distribution for all batches are summarized.
- The coating RSD resulted to be always below 6% as desired; in addition the coating losses were significantly reduced thereby increasing the batch size.
- The analytical results of Riboflavine Content Uniformity showed that the drug was homogenously layered on the cores.
- The individual tablet coating thickness resulted to be uniform on both side and edge as evidenced by the morphological analysis.
| Results | Pilot M | Pilot L | Prod M | Prod L |
| Coating RSD (%) | 2.58 | 6.00 | 3.65 | 1.80 |
| Coating Losses (%) | 10.80 | 11.50 | 9.00 | 7.00 |
| Riboflavine CU RSD (%) | 5.39 | 6.00 | 5.71 | 5.03 |
| Coating Morphology |
|
|
|
SIDE |
|
|
|
|
EDGE |
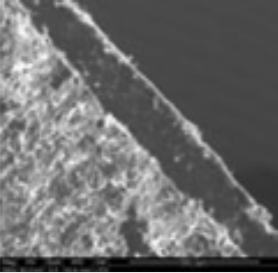
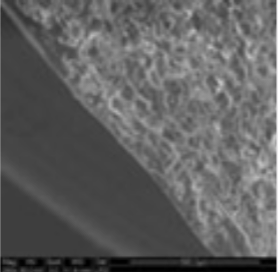
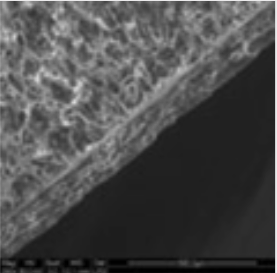
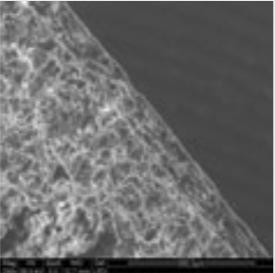
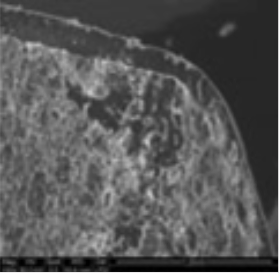
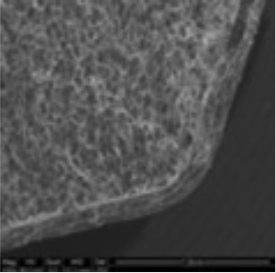
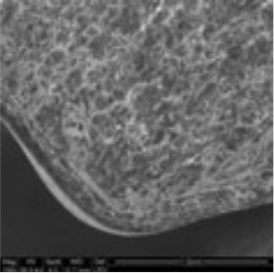
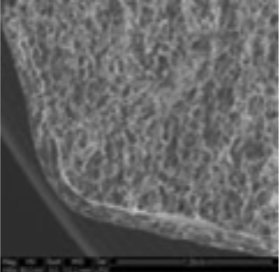
Table 4: Results of uniformity of coating distribution
6. Conclusions
The results of the study indicate that coating uniformity can be achieved on medium and maximum pan loads of the pilot scale and can also be easily up-scaled when the pilot and production equipment maintain geometric similarity.
References
[1] Tobiska and Kleinebudde, 2003. Eur. J. Pharm. Biopharm. 56, 3–9.
[2] Moes et al., 2008. Int. J. Pharm. 357, 108–118.
[3] Pandey et al., 2006. AAPS PharmSciTech. 7 (4) E1-E8.
[4] Rege et al., 2002. Int. J. Pharm.
Dismissclose
Relive
Relive
Achema
The exclusive tech videos shot during Achema 2024 are now available on our dedicated website