menu

Pharma Website
Choose the market
blur_on
Quality by Design Approach for Lyophilization Process Scale-up.
Introduction to the QbD Scale-up Approach For Lyophilization
The Quality by Design (QbD) term was originally introduced in the pharmaceutical lexicon in 2005 via ICH Q8(R2) and additionally described in ICH Q9 and Q10.1 In essence, QbD is a systematic risk management approach which emphasizes maximum product-, process-understanding, and process control in contrast to a trial and error-based quality control approach that banks on success primarily via end stage product testing.2 Figure 1 shows the critical elements of a QbD loop.3
The scale-up of a lyophilization process from laboratory dryer to commercial dryer requires that a correlation between the heat transfer and product resistance components should be established to minimize the risk of failure.4
The intended benefits of a QbD approach include regulatory relief during the product life cycle because post-approval changes within the process design space (PDS) do not require additional regulatory approval, and facilitation of continuous process improvement, because these process improvements do not require pre-approval.5
Challenges Encountered During Lyophilization Process Scale-up
The primary mechanisms involved in heat transfer to product during a lyophilization process include direct transfer of heat from shelves, and radiative transfer of heat from side walls and door. Additionally, the rate of the heat transfer during primary drying is influenced by the pressure. The important factors that make the physics of the heat and mass transfer different between lab and GMP lyophilizers are:
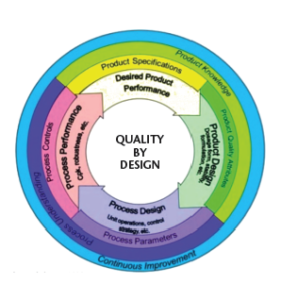
Figure 1. QbD concept supported by US-FDA3

Figure 2. Sources of key contributors of Kv inside a lyophilizer 7
Heat Transfer Differences Between Lyophilizers Differences in Vial Heat Transfer Coefficients (Kv)
Kv is an important factor which determines the product temperature during cooling and primary drying steps of a lyophilization process. The key contributors to the total Kv are described in the following equation 1:6
Kv = Kc + Kr + Kg = 1
Where: Kc = Heat transfer due to direct contact with shelf, Kr = Radiative heat transfer and Kg = Gas conduction between shelf and the bottom of the vial. It is pertinent to note that even for the same vial type, the difference in Kv between a lab (e.g. IMA Lyofast 3, 2.3 m2) versus a commercial lyophilizer (e.g. LMX 52, 52 m2 shelf area) can pose a significant risk of failure during the process scale-up.
Differences in Product Resistance to Mass Flow (Rp)
The product resistance (Rp) is the resistance to vapor flow through the dried layer formed in the product vial during primary drying. Along with Kv, Rp is a key determinant of the product temperature4 because it influences the product temperature profile which needs to be in an optimal range to avoid collapse as well as maintain stability of products and the time to complete primary drying.7
The Rp of a product is strongly influenced by the degree of supercooling achieved during a freezing step of a lyophilization process. The degree of the supercooling is defined as the difference between equilibrium freezing point and the temperature (Tn) at which the ice crystals first form in the sample. It impacts the rate of the ice nucleation and the size of the ice crystals and consequently the Rp as shown in Figure 3.10
The impact of supercooling on Rp due to the requirement of a class 100 air environment in a GMP facility cannot be ignored during any scale-up effort, as the average Tn in commercial lyophilizers can be 10°C lower than in a laboratory lyophilizer.4 Therefore, the determination of Rp in both settings is the most desired scenario for a QbD scale-up effort. However, the determination of Rp in a commercial lyophilizer with an integral condenser design is not practical due the lack of an isolation valve required for manometric temperature measurement (MTM). Therefore, a QbD scale-up approach for integral condenser lyos like LMX 52, recommends Rp correlation between lab and commercial lyophilizer via specific surface area (SSA) measurement.4 Figure 4 below shows the difference in Rp of 5% sucrose formulation as a function of its nucleation temperature (Tn). 4

Figure 3. Scanning Electron Microscopy image of the matrix pore size of 5% mannitol ice nucleated at -5 °C (left) vs -15 °C (right)10
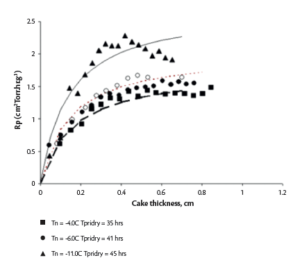
Figure 4. (L) SSA as a function of Tn (R) Product resistance of 5% sucrose as a function of its dry layer thickness4
| Excipient | Tn (°C) | SSA (m2/g) |
| Sucrose | -1.0 | 0.32 ± 0.03 |
| -6.0 | 0.42 ± 0.03 | |
| -11.0 | 0.61 ± 0.03 | |
| Dextran | -1.5 | 0.37 ± 0.14 |
| -7.0 | 0.57 ± 0.06 | |
| -10.0 | 0.71 ± 0.03 | |
| HES | -1.5 | 0.85 ± 0.02 |
| -6.5 | 0.87 ± 0.04 | |
| -9.5 | 1.08 ± 0.05 | |
| Mannitol | -1.5 | 3.64 ± 0.24 |
| -6.5 | 3.94 ± 0.45 | |
| -10.0 | 4.45 ± 0.43 |
Differences in Design and Process Control Between Lyophilizers Shelf Surface Temperature Variations Due to Different Designs
The design of the fluid circulation path and the construction of lyophilizer shelves can significantly impact the shelf temperature uniformity. For scale-up purposes, it is reasonable to assume that the shelf surface temperature gradient between lyophilizers of different capacities and size may not be the same.4 A QbD scale-up effort requires that variability in shelf surface temperature distribution of a lyophilizer should be mapped during validation runs.
Differences in Process Control Between Lyophilizers
Finally, differences in the process control due to use of components with for pressure control (e.g. capacitance manometer vs. Pirani control), can also add challenges to the scale-up process. Due to differences in various subsystems such as refrigeration, heat transfer and vacuum, the process control varies between lab-and production-scale freeze dryers. For example, the shelf heating and cooling rates, as well as the ultimate shelf temperatures, can differ between lyophilizers and this will impact process design and scale-up.
Steps Proposed by IMA-Lab for Life for the QbD Process Scale-up to GMP Lyophilizers
To quantify the differences in heat and mass transfer characteristics between lyophilizers, IMA recommends the following strategy for the QbD scale-up from Lyofast 3 (2.3 m2) to LMX 52 (52 m2) lyophilizers.
Step1) Equipment Limit Determination
Equipment capability is an important factor in scale-up of lyophilized products as it establishes a relationship between process control parameters like shelf temperature and pressure and defines one of the boundary limits of a QbD process design space (PDS).10
In lyophilizers with an integral condenser design, the location of integral condenser and diameter of the separation plate may influence the vapor flow from chamber to condenser. Additionally, an integral condenser also has a strong potential to cool down the divider wall due to direct exposure to the condenser coils. This may have a serious implication for any scale-up transfer from a ducted lyo to a lyo with integral condenser. Finally, it is important to note that every lyophilizer has the lowest pressure limit that it can control during sublimation with a full product load11.

Figure 5. Moisture mapping scheme during validation to identify hot and cold spots on the shelf of a GMP lyophilizer
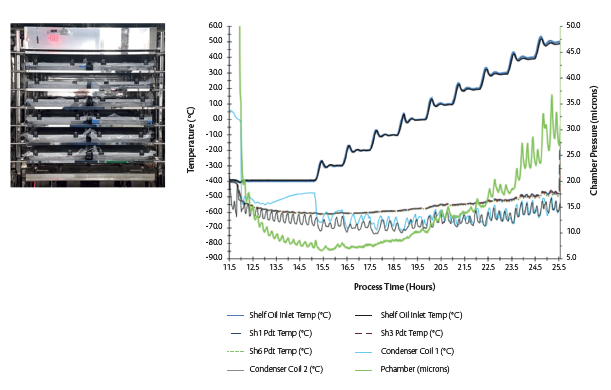
Figure 6. (L) A representative test set-up for the minimum controllable chamber pressure test in GMP LMX 5 (5 m2) with a bottom integral condenser with temperature probes and water-filled trays (R) Plot showing variations in chamber pressure as a function of the shelf temperature.
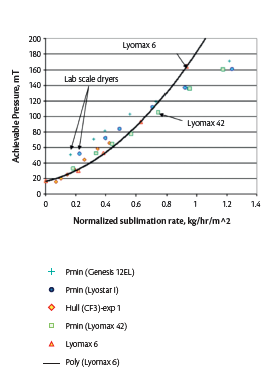
Figure 7. Representative the minimum controllable chamber pressure vs normalized sublimation rate achieved by lyophilizers of different sizes12
Minimum Controllable Chamber Pressure Test
The objective of a minimum controllable chamber pressure test is to quantify the equipment limit for a dynamic set-up of vapor flow at varying shelf temperatures. Primary factors affecting minimum controllable chamber pressure are location and design of the condenser, refrigeration capacity and vacuum performance.
Figure 8. (L) Representative Kv determination in a GMP Lyomax 5 lyophilizer with a bottom integral condenser 3 (2.3 m2) lab lyophilizer
Step 2) Kv Determination in GMP Lyophilizers
The heat transfer from lyophilizer to the vial is dependent on the temperature, pressure, lyophilizer geometry and the specific vial type used in a lyophilization process. While the vial type for a given product is always kept the same during lyo process development and scale-up, the differences in heat transfer due to geometry and vapor flow between a lab and commercial lyophilizer should be quantified via Kv determination in both lyophilizers.
Additionally, to determine the impact of the edge effect phenomenon on the “edge of product failure” situation, Kv comparison between the center and the edge vials in lab and commercial lyophilizer should also be accounted for.

Figure 9. (L) Differences in Kv of 6R vials observed in IMA lyophilizers (R) The edge effect seen through the difference in edge vs center vial Kv of 2R vials in Lyofast 3 (2.3 m2) lab lyophilizer.
Proposed Development of Kv Framework for Select Vial Type
With a determination of Kv for a specific vial type in IMA Lyofast 3 (2.3 m2) lyophilizer and LMX 52 (52 m2) lyophilizer, a framework that quantitatively connects Kv can be built using a simple mathematical approach. The development of such a Kv framework will enable a more accurate QbD scale-up transfer from IMA Lyofast 3 to any LMX 52. The availability of product temperature data obtained from a single validation run will allow the development of scale-up lyo process for LMX 52 to be practically seamless.
[Kv(Tsh – Tb)]Lab = [Kv(Tsh – Tb)] lmx52 = 2
Lab = Data collected during process development in IMA lab Lyostar 3 (2.3 m2) lyophilizer
LMX52 = Data collected during Kv determination in GMP lyophilizer
TbLMX52 = Product temperature collected during validation run in LMX52 (both edge and center vial Tb required).
Summary
A QbD based lyophilization process scale-up approach is the industry standard adopted by all major pharmaceutical companies in USA and western Europe. This approach significantly enhances the equipment-process-understanding and allows implementation of control solutions that can continually validate the desired target product profile (TPP) of lyophilized products. Additional advantages of such a QbD approach include regulatory benefits for process changes (within the design space limits) and the availability of critical data required for the analysis of a batch failure throughout the commercial lifecycle of lyophilized products.
References
[1] ICH Q8 (R2) guidelines (accessed May 20, 2021)
[2] Dixon D. et. al., AAPS Advances in Pharmaceutical Sciences, (2018) (38) 17, p430-431
[3] Pommeranz, S., Will the FDA Continue Its Initiative “cGMPs for the 21st Century” European Compliance Academy (accessed September 28, 2021)
[4] Rambhatla S. et. al., AAPS PharmSciTech (2004); 5 (4)
[5] Nail S.L. et. al., BioPharm International, 21, Issue 1
[6] Rambhatla S. et. al., AAPS PharmSciTech (2003); 4 (2)
[7] Sigmon J. et. al., ISPE CaSA Technology Conference (2018)
[8] Oddone, I. et. al., International Journal of Pharmaceutics, 524(1-2) (2017) 134-140.
[9] Bogner R.H., SP Scientific Webinar, March 23 (2020)
[10] Srinivasan J.M. et. al., AAPS PharmSciTech (2021); 22 (53)
[11] Kshirsagar V.R. et. al., Journal of Pharmaceutical Sciences, 108 (2019) 382-39.
[12] Tchessalov S., SP Scientific Webinar, June 21 (2016)
![]()